Termo do glossário: Tipo espectral
Descrição: As estrelas são classificadas em tipos espectrais de acordo com a presença de características em seus espectros.
Para a maioria das estrelas, o tipo espectral baseia-se principalmente na temperatura da superfície estelar e segue uma sequência: O, B, A, F, G, K e M, listados da mais quente à mais fria. Essa sequência foi recentemente ampliada para incluir os tipos mais frios L, T e Y. Esses três representam, em sua maioria, anãs marrons, mas alguns objetos com tipo espectral L são estrelas, e não anãs marrons.
Existem também letras para classificar classes especiais de estrelas. Estrelas de carbono são aquelas com características espectrais marcantes decorrentes de moléculas que contêm carbono. Elas são classificadas como tipo C. Estrelas do tipo S são intermediárias entre os tipos K ou M e C, pois as abundâncias de oxigênio e carbono na superfície são quase iguais. As anãs brancas são divididas em uma série de tipos diferentes com base nas características de seus espectros; todos esses tipos começam com a letra D (DA, DB, etc.). Estrelas quentes e massivas com linhas de emissão largas têm uma série de tipos que começam com W (WN, WC, WO).
A notação atual é um legado da primeira tentativa moderna de classificação, realizada no Observatório do Harvard College. As classes, originalmente designadas de A a Q em ordem alfabética, foram posteriormente reordenadas como uma sequência de temperatura, resultando nos principais tipos ainda utilizados hoje. As principais classes espectrais são subdivididas, denotadas pelos números de zero a nove. O Sol é do tipo espectral G2. Letras adicionais referem-se a características especiais (como “e” para estrelas com linhas de emissão brilhantes), e a classe de luminosidade, indicada por algarismos romanos, também pode ser especificada.
Termos relacionados:
- Estrela de tipo A
- Estrela do tipo B
- Estrela tipo F
- Estrela tipo K
- Espectro
- Estrela
- Sol
- Estrela do tipo G
- Estrela tipo M
- Estrela tipo O
- Classe de luminosidade
Ver este termo em outros idiomas
Status do termo e da definição: A definição original deste termo em inglês foi aprovada por um astrônomo(a) pesquisador(a) e um(a) professor(a) A tradução deste termo e de sua definição ainda aguarda aprovação
O Glossário Multilíngue da OAE é um projeto do Escritório da IAU de Astronomia para a Educação (OAE) em colaboração com o Escritório da IAU para Divulgação da Astronomia (OAO). Os termos e definições foram selecionados, escritos e revisados por meio de um esforço coletivo da OAE, dos Centros e Nós da OAE, dos Coordenadores Nacionais de Educação em Astronomia (NAECs) da OAE e de outros voluntários. Você pode encontrar uma lista completa dos créditos aqui. Todos os termos do glossário e suas definições são disponibilizados sob uma licença Creative Commons CC BY-4.0 e devem ser creditados à "IAU OAE".
Se você notar algum erro factual ou de tradução neste termo do glossário ou em sua definição, por favor entre em contato.
Em outros idiomas
- Árabe: النوع الطيفي
- Alemão: Spektralklasse
- Inglês: Spectral Type
- Francês: Type spectral
- Italiano: Tipo spettrale
- Japonês: スペクトル型(星の) (link externo)
- Chinês Simplificado: 光谱类型
- Chinês Tradicional: 光譜類型
Diagramas relacionados
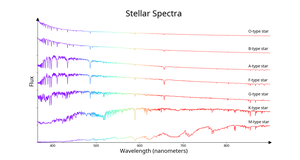
Stellar spectral types
Legenda: The spectra of seven stars ordered by spectral type ranging from the hottest (O-type) at the top to the coolest (M-type at the bottom). The x-axis shows the wavelength of light and the y-axis is a measure of the flux of light received at that wavelength. Each spectrum is normalized (the flux at each wavelength is divided by the maximum flux in that spectrum) and the spectra are then offset from each other along the y-axis to make the plot easier to view. The colour of the lines between 400 nm and 700 nm roughly corresponds to the colour the human eye would see light of that wavelength. Below 400 nm and above 700 nm, where the human eye can see little to no light, the lines are coloured blue and red respectively.
The hotter stars have more of their flux at the bluer end of the spectrum and the cooler stars have more of their flux at the redder end. However the total amount of flux a star emits depends on its size and temperature. Due to this, a hot star will emit more red light than a cool star of the same size even if the cool star emits almost all its light in red light but this is not visible in this plot due to the normalization mentioned above. The sharp, narrow drops in the spectra are absorption lines caused by atoms and ions in the stars’ atmospheres. The strength of a spectral line depends on the temperature of a star’s atmosphere. Take the hydrogen line at 656.5 nm as an example. All of the stars in this plot are primarily made of hydrogen, but the 656.5 nm hydrogen line is weak for the hottest and coolest stars but strongest for spectral types A and F. This is because hydrogen absorbs more light at 656.5 nm at the temperatures of A and F stars’ atmospheres than in hotter or cooler stars.
The coolest star here, the M-type star, has wide absorption bands in its spectra. This is because this star is cool enough to have compounds such as titanium oxide in its atmosphere. These compounds, often called molecules in astronomy, produce wider spectral absorption features than atoms or ions.
Crédito: IAU OAE/SDSS/Niall Deacon
License: CC-BY-4.0 Creative Commons Attribution 4.0 International (CC BY 4.0) ícones
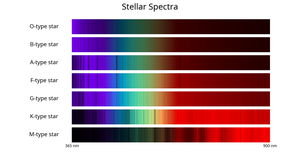
Stellar spectral types - bands
Legenda: The spectra of seven stars ordered by spectral type ranging from the hottest (O-type) at the top to the coolest (M-type at the bottom). The x-axis shows the wavelength of light while the brightness or darkness at each wavelength corresponds to the flux of light received from the star at that wavelength with darker patches having less flux and brighter patches more. Each spectrum is normalized (the flux at each wavelength is divided by the maximum flux for that spectrum) so that the maximum flux should appear with the same brightness for all the spectra. The colour plotted between 400 nm and 700 nm roughly corresponds to the color the human eye would see light of that wavelength. Below 400 nm and above 700 nm, where the human eye can see little to no light, the lines are coloured blue and red respectively.
The hotter stars have more of their flux at the bluer end of the spectrum and the cooler stars have more of their flux at the redder end. However the total amount of flux a star emits depends on its size and temperature. Due to this, a hot star will emit more red light than a cool star of the same size even if the cool star emits almost all its light in red light but this is not visible in this plot due to the normalization mentioned above. The dark, narrow patches in the spectra are absorption lines caused by atoms and ions in the stars’ atmospheres. The strength of a spectral line depends on the temperature of a star’s atmosphere. Take the hydrogen line at 656.5 nm as an example. All of the stars in this plot are primarily made of hydrogen, but the 656.5 nm hydrogen line is weak for the hottest and coolest stars but strongest for spectral types A and F. This is because hydrogen absorbs more light at 656.5 nm at the temperatures of A and F stars’ atmospheres than in hotter or cooler stars.
The coolest star here, the M-type star, has wide absorption bands in its spectra. This is because this star is cool enough to have compounds such as titanium oxide in its atmosphere. These compounds, often called molecules in astronomy, produce wider spectral absorption features than atoms or ions.
Crédito: IAU OAE/SDSS/Niall Deacon
License: CC-BY-4.0 Creative Commons Attribution 4.0 International (CC BY 4.0) ícones