Glossar-Begriff: Spektralklasse
Beschreibung: Sterne werden nach dem nach dem Aussehen ihres Lichtspektrums in Spektralklassen eingeteilt.
Bei den meisten Sternen basiert der Spektraltyp in erster Linie auf der Temperatur der Sternoberfläche und folgt einer Reihenfolge: O, B, A, F, G, K und M, vom heißesten zum kältesten. Diese Abfolge wurde kürzlich um die kühleren Typen L, T und Y erweitert. Diese drei Typen repräsentieren hauptsächlich braune Zwerge, aber einige Objekte mit dem Spektraltyp L sind eher Sterne als braune Zwerge.
Es gibt auch Buchstaben zur Klassifizierung spezieller Sternklassen. Kohlenstoffsterne sind Sterne mit starken Merkmalen in ihrem Lichtspektrum, die von kohlenstoffhaltigen Molekülen herrühren. Diese werden als Typ C klassifiziert. Sterne vom Typ S liegen zwischen den Typen K oder M und C, bei denen es nahezu gleich viel Kohlenstoff und Sauerstoff in der Atmosphäre gibt. Weiße Zwerge werden aufgrund von Merkmalen in ihren Spektren in eine Reihe verschiedener Spektraltypen eingeteilt, die alle mit dem Buchstaben D beginnen (DA, DB usw.). Für heiße, massereiche Sterne mit breiten Emissionslinien gibt es eine Reihe von Typen, die mit W beginnen (WN, WC, WO).
Die heutigen Spektraltypen basieren auf dem ersten modernen Klassifizierungsversuch, der am Harvard College Observatory unternommen wurde. Die ursprünglich alphabetisch mit A-Q bezeichneten Spektralklassen wurden später als Temperaturfolge neu geordnet, was zu den heute noch verwendeten Haupttypen führte. Die Hauptspektralklassen sind weiter in Unterklassen von 0 bis 9 unterteilt. Die Sonne gehört zum Spektraltyp G2.
Zusätzliche Buchstaben bei einer Angabe des Spektraltyps weisen auf besondere Merkmale hin (z. B. e für Sterne mit hellen Emissionslinien). Die Leuchtkraftklasse, die mit römischen Ziffern angegeben wird, kann ebenfalls angegeben werden.
Ähnliche Begriffe:
Dieser Begriff in anderen Sprachen
Begriffs- und Definitionsstatus Die Originaldefinition dieses Begriffes auf Englisch wurden von einem forschenden Astronom und einer Lehrkraft bestätigt Die Übersetzung dieses Begriffs und seiner Definition warten auf Prüfung und Bestätigung
The OAE Multilingual Glossary is a project of the IAU Office of Astronomy for Education (OAE) in collaboration with the IAU Office of Astronomy Outreach (OAO). The terms and definitions were chosen, written and reviewed by a collective effort from the OAE, the OAE Centers and Nodes, the OAE National Astronomy Education Coordinators (NAECs) and other volunteers. You can find a full list of credits here. All glossary terms and their definitions are released under a Creative Commons CC BY-4.0 license and should be credited to "IAU OAE".
Wenn dir ein inhaltlicher oder Übersetzungsfehler in diesem Glossarbegriff oder dieser Definition auffallen, bitte kontaktiere uns.
Auf anderen Sprachen
- Arabisch: النوع الطيفي
- Englisch: Spectral Type
- Französisch: Type spectral
- Italienisch: Tipo spettrale
- Japanisch: スペクトル型(星の) (externer Link)
- Brasilianisches Portugiesisch: Tipo espectral
- Vereinfachtes Chinesisch: 光谱类型
- Traditionelles Chinesisch: 光譜類型
Ähnliche Diagramme
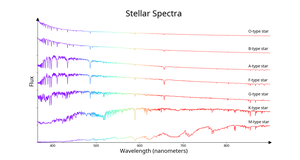
Stellar spectral types
Unterschrift: The spectra of seven stars ordered by spectral type ranging from the hottest (O-type) at the top to the coolest (M-type at the bottom). The x-axis shows the wavelength of light and the y-axis is a measure of the flux of light received at that wavelength. Each spectrum is normalized (the flux at each wavelength is divided by the maximum flux in that spectrum) and the spectra are then offset from each other along the y-axis to make the plot easier to view. The colour of the lines between 400 nm and 700 nm roughly corresponds to the colour the human eye would see light of that wavelength. Below 400 nm and above 700 nm, where the human eye can see little to no light, the lines are coloured blue and red respectively.
The hotter stars have more of their flux at the bluer end of the spectrum and the cooler stars have more of their flux at the redder end. However the total amount of flux a star emits depends on its size and temperature. Due to this, a hot star will emit more red light than a cool star of the same size even if the cool star emits almost all its light in red light but this is not visible in this plot due to the normalization mentioned above. The sharp, narrow drops in the spectra are absorption lines caused by atoms and ions in the stars’ atmospheres. The strength of a spectral line depends on the temperature of a star’s atmosphere. Take the hydrogen line at 656.5 nm as an example. All of the stars in this plot are primarily made of hydrogen, but the 656.5 nm hydrogen line is weak for the hottest and coolest stars but strongest for spectral types A and F. This is because hydrogen absorbs more light at 656.5 nm at the temperatures of A and F stars’ atmospheres than in hotter or cooler stars.
The coolest star here, the M-type star, has wide absorption bands in its spectra. This is because this star is cool enough to have compounds such as titanium oxide in its atmosphere. These compounds, often called molecules in astronomy, produce wider spectral absorption features than atoms or ions.
Bild: IAU OAE/SDSS/Niall Deacon
License: CC-BY-4.0 Creative Commons Namensnennung 4.0 International (CC BY 4.0) Symbole
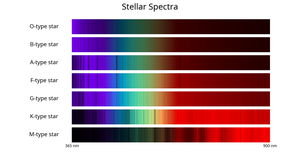
Stellar spectral types - bands
Unterschrift: The spectra of seven stars ordered by spectral type ranging from the hottest (O-type) at the top to the coolest (M-type at the bottom). The x-axis shows the wavelength of light while the brightness or darkness at each wavelength corresponds to the flux of light received from the star at that wavelength with darker patches having less flux and brighter patches more. Each spectrum is normalized (the flux at each wavelength is divided by the maximum flux for that spectrum) so that the maximum flux should appear with the same brightness for all the spectra. The colour plotted between 400 nm and 700 nm roughly corresponds to the color the human eye would see light of that wavelength. Below 400 nm and above 700 nm, where the human eye can see little to no light, the lines are coloured blue and red respectively.
The hotter stars have more of their flux at the bluer end of the spectrum and the cooler stars have more of their flux at the redder end. However the total amount of flux a star emits depends on its size and temperature. Due to this, a hot star will emit more red light than a cool star of the same size even if the cool star emits almost all its light in red light but this is not visible in this plot due to the normalization mentioned above. The dark, narrow patches in the spectra are absorption lines caused by atoms and ions in the stars’ atmospheres. The strength of a spectral line depends on the temperature of a star’s atmosphere. Take the hydrogen line at 656.5 nm as an example. All of the stars in this plot are primarily made of hydrogen, but the 656.5 nm hydrogen line is weak for the hottest and coolest stars but strongest for spectral types A and F. This is because hydrogen absorbs more light at 656.5 nm at the temperatures of A and F stars’ atmospheres than in hotter or cooler stars.
The coolest star here, the M-type star, has wide absorption bands in its spectra. This is because this star is cool enough to have compounds such as titanium oxide in its atmosphere. These compounds, often called molecules in astronomy, produce wider spectral absorption features than atoms or ions.
Bild: IAU OAE/SDSS/Niall Deacon
License: CC-BY-4.0 Creative Commons Namensnennung 4.0 International (CC BY 4.0) Symbole