This page describes an image Stellar Structure
Datei runterladen ( Bild 102.93 kB)
PDF Datei runterladen (PDF file 26.25 kB)
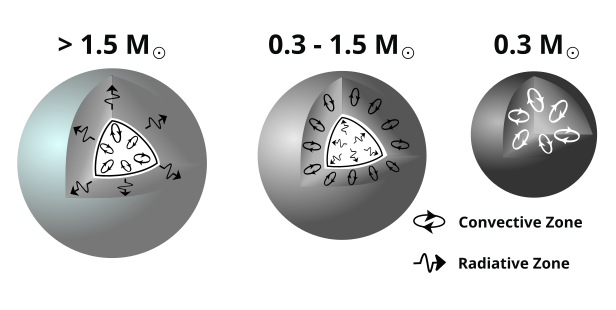
Also available in black and white
Datei runterladen ( Bild 74.95 kB)
PDF Datei runterladen (PDF file 18.56 kB)
Untertitel Diagramm:
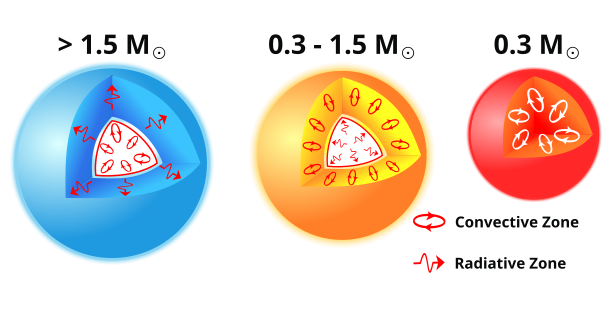
Stars are balls of plasma. For most of a star’s life it burns hydrogen into helium in its core. This phase of a star’s life is known as the main sequence. Burning hydrogen into helium produces heat, that heat travels out of the star’s core eventually reaching the star’s photosphere (often referred to as the “surface” of the star). From here the heat can radiate into space as various forms of electromagnetic radiation. However, how heat travels from the core to the photosphere depends on the star’s mass.
Imagine a parcel of gas rising inside a star. As it rises, it moves into an area of lower pressure, so it cools down and expands. If the parcel is still hotter, and therefore less dense than its surroundings, it keeps moving upward due to buoyancy. Eventually, it will rise far enough to cool and sink back down. This rising and sinking cycle is called convection. Whether convection occurs depends on how quickly temperature changes as you move away from the star’s core. If the temperature in a star drops rapidly, rising parcels of gas are more likely to stay hotter than their surroundings, so convection dominates as the mode of energy transfer in this part of the star. Conversely if the temperature drops more slowly (i.e. if the temperature gradient is small) then heat will mostly be transferred by radiation (photons).
In the most massive main sequence stars (more massive than about 1.5 times the mass of the Sun, seen here on the left), hydrogen is burned into helium using the CNO cycle. This is highly temperature dependent and thus energy production is concentrated near the center of the star. This leads to a larger temperature gradient and thus a convective core. Further out the temperature gradient becomes smaller and heat transport is dominated by radiation. This is called the radiative zone.
For lower mass stars like the Sun (between 0.3 and 1.5 solar masses, seen here in the middle) hydrogen is burned to helium using a different process (the pp chain). This depends less on the internal temperature than the CNO cycle and so energy production is more distributed in the star’s core. This leads to a smaller temperature gradient and thus a radiative core where convection occurs surrounded by a radiative zone. Going further out the gas becomes cool enough for some elements to hang to on some of their electrons, i.e. not being completely ionised. This partially ionised gas is more opaque to photons, trapping heat. This leads to a large temperature gradient and thus convection.
The lowest mass stars (below 0.3 solar masses, seen here on the right) have no radiative zone and are fully convective.
The arrows in the radiative zone are shown as wavy lines heading out of the star. However, a photon’s journey out of a star is much more complex with each individual photon travelling only a short distance before being deflected by some of the charged particles that make up the plasma of the star’s interior. This leads to a long and winding road that takes millennia instead of the few seconds it would take if the photon did not interact with particles in the plasma.
Quelle Diagramm: Based on a vector diagram by Wikimedia user Д.Ильин which itself is based on a diagram from sun.org. Link zur Quelle
Diagramm Übersetzungsstatus: Noch nicht bestätigt von einem Rezensenten
Diagramm-Lizenz: Creative Commons Namensnennung 4.0 International (CC BY 4.0) Creative Commons Namensnennung 4.0 International (CC BY 4.0) Symbole
Ähnliche Glossarbegriffe:
Elektromagnetische Strahlung
, Kern (Stern)
, Konvektionszone
, Photosphäre
, Sternaufbau
, Strahlungszone
, Wasserstoffbrennen
Kategorien:
Sterne
Möchtest du deine eigene Übersetzung oder Version dieses Diagrammes erstellen? Dann downloade die SVG
Version dieses Diagrammes auf Englisch (25.91 kB). Du kannst diese Version mit Programmen wie Inkscape (kostenlos) oder Adobe Illustrator (kostenpflichtig) bearbeiten. Bitte verweise dennoch auf den originalen Autor.
Also available in black and white ( Bild 25.91 kB).
Du kannst Deine eigene Version oder Übersetzung dieses Diagrammes erstellen, indem du einer textlosen Version dieses Diagrammes eigenen Text zufügst.
Downloade einfach eine dieser Dateien:
Download Text-Free File ( Bild 90.05 kB)
Download Text-Free PDF File (PDF file 20.89 kB)
Also available in black and white:
Download Text-Free File ( Bild 62.96 kB)
Download Text-Free PDF File (PDF file 13.23 kB)
The diagram captions presented on the OAE website were written, translated and reviewed by a collective effort from the OAE, the OAE Centers and Nodes, the OAE National Astronomy Education Coordinators (NAECs) and other volunteers. You can find a full list of credits for our translation project here. All media file captions are released under a Creative Commons CC BY-4.0 license and should be credited to "IAU OAE". The media files themselves may have different licenses (see above) and should be credited as listed above under "credit".
Sollte dir ein Fehler in diesem Diagramm oder seiner Unterschrift auffallen, bitte kontaktiere uns.


