This page describes an image Stellar Structure
Scarica File ( immagine 102.93 kB)
Scarica il file PDF (PDF file 26.25 kB)
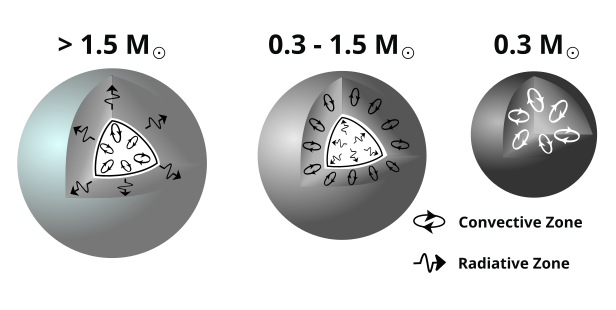
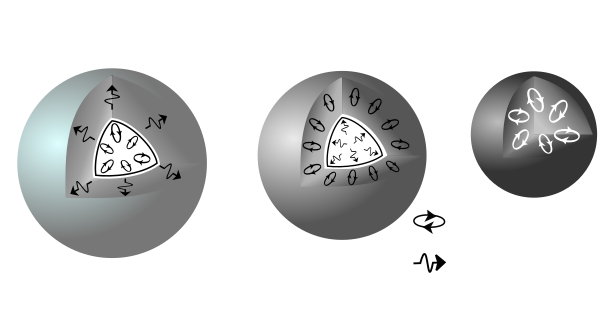
Also available in black and white
Scarica File ( immagine 74.95 kB)
Scarica il file PDF (PDF file 18.56 kB)
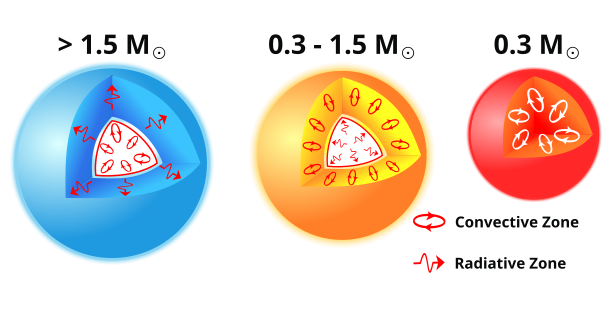
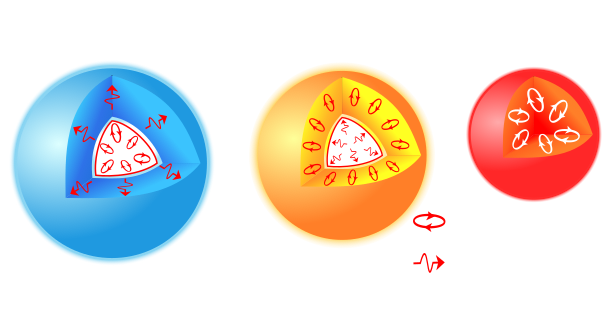
Didascalia del diagramma:
Stars are balls of plasma. For most of a star’s life it burns hydrogen into helium in its core. This phase of a star’s life is known as the main sequence. Burning hydrogen into helium produces heat, that heat travels out of the star’s core eventually reaching the star’s photosphere (often referred to as the “surface” of the star). From here the heat can radiate into space as various forms of electromagnetic radiation. However, how heat travels from the core to the photosphere depends on the star’s mass.
Imagine a parcel of gas rising inside a star. As it rises, it moves into an area of lower pressure, so it cools down and expands. If the parcel is still hotter, and therefore less dense than its surroundings, it keeps moving upward due to buoyancy. Eventually, it will rise far enough to cool and sink back down. This rising and sinking cycle is called convection. Whether convection occurs depends on how quickly temperature changes as you move away from the star’s core. If the temperature in a star drops rapidly, rising parcels of gas are more likely to stay hotter than their surroundings, so convection dominates as the mode of energy transfer in this part of the star. Conversely if the temperature drops more slowly (i.e. if the temperature gradient is small) then heat will mostly be transferred by radiation (photons).
In the most massive main sequence stars (more massive than about 1.5 times the mass of the Sun, seen here on the left), hydrogen is burned into helium using the CNO cycle. This is highly temperature dependent and thus energy production is concentrated near the center of the star. This leads to a larger temperature gradient and thus a convective core. Further out the temperature gradient becomes smaller and heat transport is dominated by radiation. This is called the radiative zone.
For lower mass stars like the Sun (between 0.3 and 1.5 solar masses, seen here in the middle) hydrogen is burned to helium using a different process (the pp chain). This depends less on the internal temperature than the CNO cycle and so energy production is more distributed in the star’s core. This leads to a smaller temperature gradient and thus a radiative core where convection occurs surrounded by a radiative zone. Going further out the gas becomes cool enough for some elements to hang to on some of their electrons, i.e. not being completely ionised. This partially ionised gas is more opaque to photons, trapping heat. This leads to a large temperature gradient and thus convection.
The lowest mass stars (below 0.3 solar masses, seen here on the right) have no radiative zone and are fully convective.
The arrows in the radiative zone are shown as wavy lines heading out of the star. However, a photon’s journey out of a star is much more complex with each individual photon travelling only a short distance before being deflected by some of the charged particles that make up the plasma of the star’s interior. This leads to a long and winding road that takes millennia instead of the few seconds it would take if the photon did not interact with particles in the plasma.
Crediti per il Diaframma: Based on a vector diagram by Wikimedia user Д.Ильин which itself is based on a diagram from sun.org. Link per i Crediti
Stato di traduzione del Diagramma: Non ancora approvato da un revisore
Licenza diagramma: Creative Commons Attribuzione 4.0 Internazionale (CC BY 4.0) Creative Commons Attribuzione 4.0 Internazionale (CC BY 4.0) icone
Termini di glossario connessi:
Fotosfera
, Fusione di idrogeno
, Radiazione elettromagnetica
, Struttura stellare
, Zona radiativa
, nucleo stellare
, zona convettiva
Categorie:
Stelle
Want to make your own translation or version of this diagram? Then
download the SVG
version of this diagram in English (25.91 kB). You can edit this using
software like Inkscape (free) or Adobe Illustrator
(proprietary). Just remember to credit the author of the original appropriately.
Also available in black and white ( immagine 25.91 kB).
You can also make your own version or translation of this diagram by adding adding text to a version of
this diagram with no text. Just download one of the following files:
Download Text-Free File ( immagine 90.05 kB)
Download Text-Free PDF File (PDF file 20.89 kB)
Also available in black and white:
Download Text-Free File ( immagine 62.96 kB)
Download Text-Free PDF File (PDF file 13.23 kB)
If you notice a error in this diagram or its caption then please get in touch.


