Termo do glossário: Diagrama de Hertzsprung–Russell (HR)
Descrição: O diagrama de Hertzsprung–Russell (ou HR) é um gráfico que representa duas propriedades observacionais das estrelas: em um eixo, a energia total emitida pelas estrelas (luminosidade); e no outro eixo, sua temperatura efetiva ou seu tipo espectral. Quando se utiliza a temperatura efetiva, ela é representada em uma escala logarítmica, aumentando da direita para a esquerda. O diagrama HR recebeu esse nome em homenagem a dois cientistas: Ejnar Hertzsprung e Henry Norris Russell, que foram os primeiros a elaborar diferentes versões desse gráfico com o objetivo de compreender as propriedades das estrelas. Os pontos de dados correspondentes às chamadas “estrelas da sequência principal” situam-se em uma faixa diagonal que vai do canto superior esquerdo ao canto inferior direito neste gráfico. Os pontos de dados correspondentes às estrelas gigantes situam-se acima e à direita da faixa da sequência principal. As anãs brancas situam-se abaixo e à esquerda da faixa.
O diagrama HR também pode ser uma estrutura útil para representar a evolução de uma estrela ao longo do tempo. Uma vez formada, a estrela se posicionará na sequência principal do diagrama HR, e sua temperatura e luminosidade permanecerão aproximadamente constantes por algum tempo. Posteriormente, à medida que evolui, a temperatura da estrela diminuirá e sua luminosidade aumentará. Isso significa que a posição da estrela no diagrama HR se desloca para cima e para a direita, afastando-se da sequência principal em direção ao ramo das gigantes. A evolução de uma estrela, especificamente suas mudanças de temperatura e luminosidade, pode ser representada por uma curva no diagrama HR. Assim, o estado evolutivo de uma estrela pode ser determinado a partir de sua temperatura e luminosidade, utilizando-se do diagrama HR.
Termos relacionados:
- Estrela anã
- Estrela gigante
- Luminosidade
- Sequência Principal
- Estrela
- Estrela supergigante
- Anã Branca
- Temperatura efetiva
- Classe de luminosidade
Ver este termo em outros idiomas
Status do termo e da definição: A definição original deste termo em inglês foi aprovada por um astrônomo(a) pesquisador(a) e um(a) professor(a) A tradução deste termo e de sua definição ainda aguarda aprovação
O Glossário Multilíngue da OAE é um projeto do Escritório da IAU de Astronomia para a Educação (OAE) em colaboração com o Escritório da IAU para Divulgação da Astronomia (OAO). Os termos e definições foram selecionados, escritos e revisados por meio de um esforço coletivo da OAE, dos Centros e Nós da OAE, dos Coordenadores Nacionais de Educação em Astronomia (NAECs) da OAE e de outros voluntários. Você pode encontrar uma lista completa dos créditos aqui. Todos os termos do glossário e suas definições são disponibilizados sob uma licença Creative Commons CC BY-4.0 e devem ser creditados à "IAU OAE".
Se você notar algum erro factual ou de tradução neste termo do glossário ou em sua definição, por favor entre em contato.
Em outros idiomas
- Árabe: مخطط هرتزبرونغ–راسل
- Alemão: Hertzsprung-Russell-Diagramm (HRD)
- Inglês: Hertzsprung–Russell (HR) Diagram
- Espanhol: Diagrama de Hertzsprung-Russell (HR)
- Francês: Diagramme Hertzsprung-Russell (HR)
- Italiano: Diagramma di Hertzsprung-Russell (HR)
- Japonês: HR図 (link externo)
- Chinês Simplificado: 赫罗图
- Chinês Tradicional: 赫羅圖
Diagramas relacionados
Hertzsprung-Russell diagram
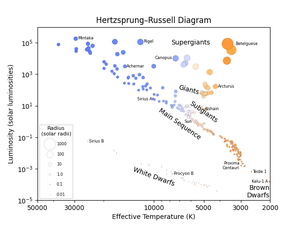
Legenda: This diagram shows the temperature and luminosity of different stars. The size of each point represents the star’s radius and its colour is the colour the human eye would see. The stars range in colour from a washed-out blue to a washed-out reddish-orange. No star has a pure colour like red, green or blue as stars’ spectra include light from lots of different colours. However the reddest stars are commonly referred to as red and the bluest stars as blue. The sample of stars used to make this diagram was chosen to show a wide range of stars of different types so the relative number of each type of star is not representative of how commonly each type is found.
From the top left to bottom right there is a long line of stars burning hydrogen in their cores. This is called the main sequence. On this line, one sees the stars Mintaka, Achernar, Sirius A, the Sun and Proxima Centauri. The objects around Proxima Centauri at the lower right end of the main sequence are known as red dwarfs. To the lower right of the red dwarfs are Teide 1 and Kelu-1 A. These two objects are brown dwarfs, objects too low in mass to have cores hot enough to fuse hydrogen for a sustained period of time. As they do not burn hydrogen, brown dwarfs are not considered main sequence stars. The name brown dwarf is unrelated to their colour.
Above the main sequence, we find subgiants, giants and supergiants. These are stars that have finished burning hydrogen in their core and have evolved into larger objects. A star’s brightness depends on its temperature and size so giant stars are brighter than stars with a smaller radius but the same temperature. In time these objects will move towards the end of their lives and undergo either a planetary nebula phase or become supernovae. Stars which end their lives with a planetary nebula phase become a type of stellar remnant called a white dwarf. Such objects are much smaller than stars of the same temperature and thus are fainter and are found significantly below the main sequence. Stars which end their lives as supernovae become either black holes or neutron stars. These are not shown on this plot.
Crédito: IAU OAE/Niall Deacon
License: CC-BY-4.0 Creative Commons Attribution 4.0 International (CC BY 4.0) ícones