This page describes an image Stellar spectral types
Baixar arquivo ( imagem 185.71 kB)
Baixar arquivo PDF (PDF file 393.16 kB)
Legenda do diagrama:
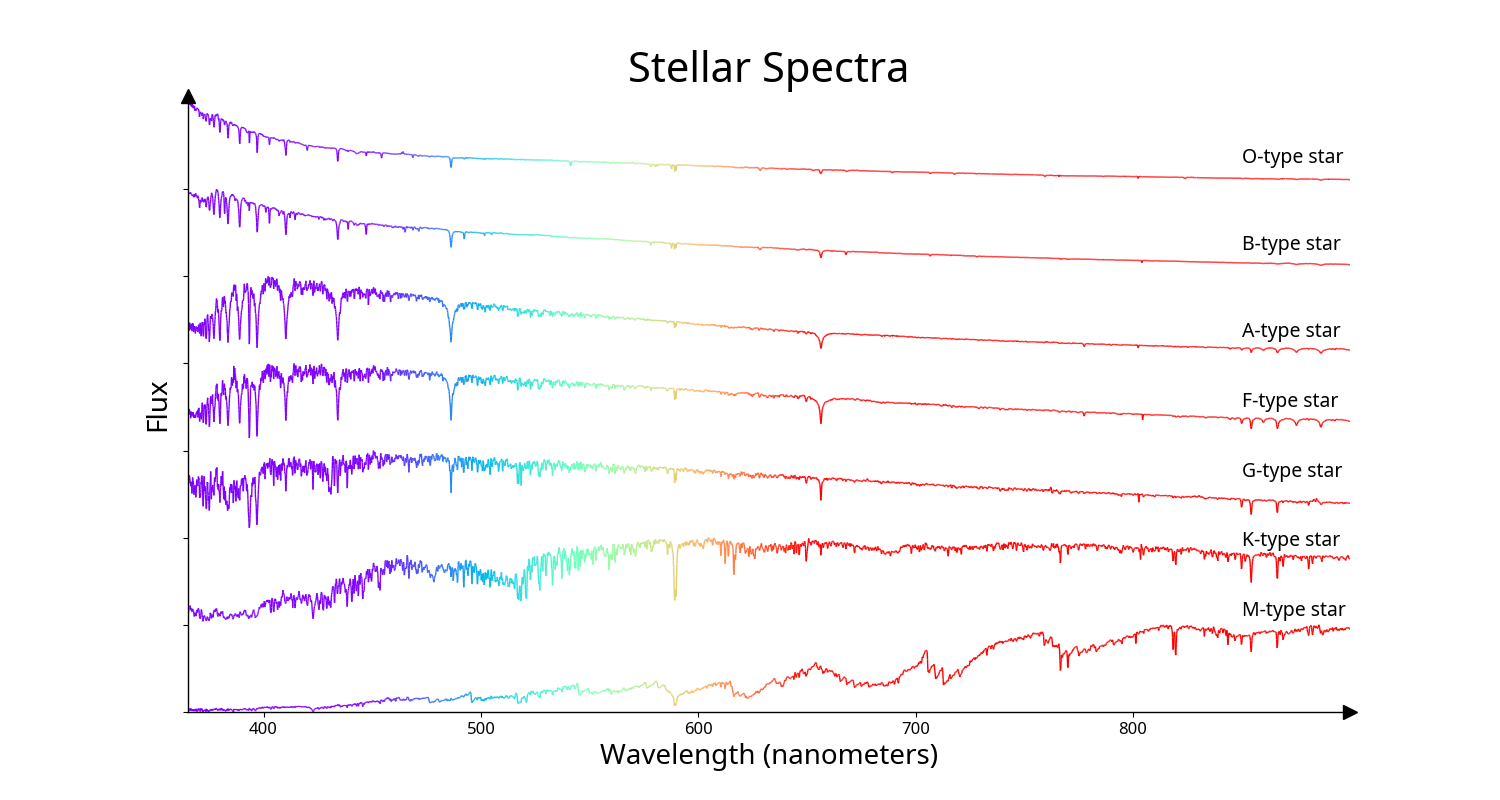
The spectra of seven stars ordered by spectral type ranging from the hottest (O-type) at the top to the coolest (M-type at the bottom). The x-axis shows the wavelength of light and the y-axis is a measure of the flux of light received at that wavelength. Each spectrum is normalized (the flux at each wavelength is divided by the maximum flux in that spectrum) and the spectra are then offset from each other along the y-axis to make the plot easier to view. The colour of the lines between 400 nm and 700 nm roughly corresponds to the colour the human eye would see light of that wavelength. Below 400 nm and above 700 nm, where the human eye can see little to no light, the lines are coloured blue and red respectively.
The hotter stars have more of their flux at the bluer end of the spectrum and the cooler stars have more of their flux at the redder end. However the total amount of flux a star emits depends on its size and temperature. Due to this, a hot star will emit more red light than a cool star of the same size even if the cool star emits almost all its light in red light but this is not visible in this plot due to the normalization mentioned above. The sharp, narrow drops in the spectra are absorption lines caused by atoms and ions in the stars’ atmospheres. The strength of a spectral line depends on the temperature of a star’s atmosphere. Take the hydrogen line at 656.5 nm as an example. All of the stars in this plot are primarily made of hydrogen, but the 656.5 nm hydrogen line is weak for the hottest and coolest stars but strongest for spectral types A and F. This is because hydrogen absorbs more light at 656.5 nm at the temperatures of A and F stars’ atmospheres than in hotter or cooler stars.
The coolest star here, the M-type star, has wide absorption bands in its spectra. This is because this star is cool enough to have compounds such as titanium oxide in its atmosphere. These compounds, often called molecules in astronomy, produce wider spectral absorption features than atoms or ions.
Crédito do diagrama: IAU OAE/SDSS/Niall Deacon.
Status da tradução dos diagramas: Ainda não aprovado por um revisor
Criado com o apoio de: OAE Main Office
Licença do diagrama: Creative Commons Atribuição 4.0 Internacional (CC BY 4.0) Creative Commons Atribuição 4.0 Internacional (CC BY 4.0) ícones
Termos relacionados do glossário:
Comprimento de onda
, Espectro
, Tipo espectral
Categorias
Estrelas
Quer criar sua própria versão deste diagrama? Então dê uma olhada no código que
gerou este diagrama no Github
Você também pode criar sua própria versão ou tradução deste diagrama adicionando texto a uma versão
deste diagrama sem texto. Basta baixar um dos arquivos abaixo:
Baixar arquivo sem texto ( imagem 155.72 kB)
Baixar arquivo PDF sem texto (arquivo PDF 383.54 kB)
Diagramas relacionados
Spectrum of an O-type starSpectrum of a B-type star
Spectrum of an A-type star
Spectrum of an F-type star
Spectrum of a G-type star
Spectrum of a K-type star
Spectrum of an M-type star
Stellar spectral types - bands
Em outros idiomas
Inglês: Stellar spectral typesItaliano: Tipi spettrali stellari
Francês: Types spectraux stellaires
Espanhol: Tipos espectrales estelares
Árabe: الأنواع الطيفية النجمية
Chinês Tradicional: 恒星光譜類型
Chinês Simplificado: 恒星光谱类型
As legendas dos diagramas apresentadas no site da OAE foram escritas, traduzidas e revisadas por meio de um esforço coletivo da OAE, dos Centros e Nós da OAE, dos Coordenadores Nacionais de Educação em Astronomia (NAECs) da OAE e de outros voluntários. Você pode encontrar a lista completa de créditos do nosso projeto de tradução aqui. Todas as legendas de arquivos de mídia são publicadas sob uma licença Creative Commons CC BY-4.0 e devem ser creditadas à "IAU OAE". Os próprios arquivos de mídia podem ter licenças diferentes (veja acima) e devem ser creditados conforme indicado acima em "crédito".
Se você notar algum erro neste diagrama ou em sua legenda, por favor entre em contato.