Glossary term: 전자기복사
Description: 전기와 자기의 현상을 연구하던 19세기 물리학자들은 근처에 전하가 없어도 전기장과 자기장이 상호 유도 작용에 의해 파동의 형태로 공간을 통해 빛의 속도로 전파될 수 있다는 사실을 발견했습니다. 이러한 파동을 전자기파 또는 전자기복사라고 합니다. 기본 전자기파를 파장에 따라 분류했을 때, 단파장에서 장파장에 이르는 전자기스펙트럼에는 감마선, X-선, 자외선, 가시광선, 적외선, 서브미리파, 전파(밀리미터파/마이크로파 포함)가 포함됩니다. 천문학에서는 먼 천체로부터의 전자기복사가 해당 천체에 대한 정보를 제공해주는 가장 중요한 원천입니다.
Related Terms:
- Electromagnetic Force
- Gamma Ray
- 적외선(IR)
- Light
- 마이크로파복사
- 자외선
- Visible Spectrum
- Submillimeter Astronomy
- 엑스선
See this term in other languages
Term and definition status: The original definition of this term in English have been approved by a research astronomer and a teacher The translation of this term and its definition is still awaiting approval
The OAE Multilingual Glossary is a project of the IAU Office of Astronomy for Education (OAE) in collaboration with the IAU Office of Astronomy Outreach (OAO). The terms and definitions were chosen, written and reviewed by a collective effort from the OAE, the OAE Centers and Nodes, the OAE National Astronomy Education Coordinators (NAECs) and other volunteers. You can find a full list of credits here. All glossary terms and their definitions are released under a Creative Commons CC BY-4.0 license and should be credited to "IAU OAE".
If you notice a factual or translation error in this glossary term or definition then please get in touch.
In Other Languages
- 아랍어: الإشعاع الكهرومغناطيسي
- 독일어: Elektromagnetische Strahlung
- 영어: Electromagnetic Radiation
- 스페인어: Radiación electromagnética
- 프랑스어: Rayonnement électromagnétique
- 힌두어: इलेक्ट्रोमॅग्नेटिक रेडिएशन (विद्युतचुंबकीय विकिरण)
- 이탈리아어: Radiazione elettromagnetica
- 일본어: 放射 (external link)
- 마라티어: इलेक्ट्रोमॅग्नेटिक रेडिएशन (विद्युत चुंबकीय विकिरण)
- 브라질 포르투갈어: Radiação eletromagnética
- 중국어 간체: 电磁辐射
- 중국어 번체: 電磁輻射
Related Diagrams
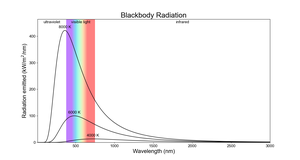
Blackbody Radiation
Caption: The curves of emitted radiation from blackbodies of different temperatures. The x-axis shows wavelength and the y-axis shows the amount of energy emitted every second by a square meter of the surface of that blackbody at each wavelength.
The hotter the body, the shorter the wavelength and the bluer the light it emits its maximum amount of energy at. Despite the coolest body in this plot peaking in red light, the other hotter bodies all emit more red light than the coolest body.
Credit: IAU OAE/Niall Deacon
License: CC-BY-4.0 Creative Commons 저작자표시 4.0 국제 (CC BY 4.0) icons
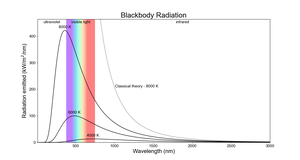
Blackbody Radiation - UV Catastrophe
Caption: The curves of emitted radiation from blackbodies of different temperatures. The x-axis shows wavelength and the y-axis shows the amount of energy emitted every second by a square meter of the surface of that blackbody at each wavelength.
The hotter the body, the shorter the wavelength and the bluer the light it emits its maximum amount of energy at. Despite the coolest body in this plot peaking in red light, the other hotter bodies all emit more red light than the coolest body.
The dotted line shows the emitted radiation predicted by classical theory prior to modern quantum mechanics. This prediction tends to infinity at shorter wavelengths for any blackbody temperature above zero and was dubbed the ‘ultraviolet catastrophe’.
Credit: IAU OAE/Niall Deacon
License: CC-BY-4.0 Creative Commons 저작자표시 4.0 국제 (CC BY 4.0) icons
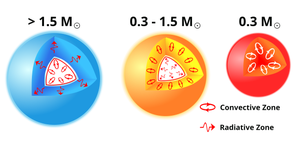
Stellar Structure
Caption: Stars are balls of plasma. For most of a star’s life it burns hydrogen into helium in its core. This phase of a star’s life is known as the main sequence. Burning hydrogen into helium produces heat, that heat travels out of the star’s core eventually reaching the star’s photosphere (often referred to as the “surface” of the star). From here the heat can radiate into space as various forms of electromagnetic radiation. However, how heat travels from the core to the photosphere depends on the star’s mass.
Imagine a parcel of gas rising inside a star. As it rises, it moves into an area of lower pressure, so it cools down and expands. If the parcel is still hotter, and therefore less dense than its surroundings, it keeps moving upward due to buoyancy. Eventually, it will rise far enough to cool and sink back down. This rising and sinking cycle is called convection. Whether convection occurs depends on how quickly temperature changes as you move away from the star’s core. If the temperature in a star drops rapidly, rising parcels of gas are more likely to stay hotter than their surroundings, so convection dominates as the mode of energy transfer in this part of the star. Conversely if the temperature drops more slowly (i.e. if the temperature gradient is small) then heat will mostly be transferred by radiation (photons).
In the most massive main sequence stars (more massive than about 1.5 times the mass of the Sun, seen here on the left), hydrogen is burned into helium using the CNO cycle. This is highly temperature dependent and thus energy production is concentrated near the center of the star. This leads to a larger temperature gradient and thus a convective core. Further out the temperature gradient becomes smaller and heat transport is dominated by radiation. This is called the radiative zone.
For lower mass stars like the Sun (between 0.3 and 1.5 solar masses, seen here in the middle) hydrogen is burned to helium using a different process (the pp chain). This depends less on the internal temperature than the CNO cycle and so energy production is more distributed in the star’s core. This leads to a smaller temperature gradient and thus a radiative core where convection occurs surrounded by a radiative zone. Going further out the gas becomes cool enough for some elements to hang to on some of their electrons, i.e. not being completely ionised. This partially ionised gas is more opaque to photons, trapping heat. This leads to a large temperature gradient and thus convection.
The lowest mass stars (below 0.3 solar masses, seen here on the right) have no radiative zone and are fully convective.
The arrows in the radiative zone are shown as wavy lines heading out of the star. However, a photon’s journey out of a star is much more complex with each individual photon travelling only a short distance before being deflected by some of the charged particles that make up the plasma of the star’s interior. This leads to a long and winding road that takes millennia instead of the few seconds it would take if the photon did not interact with particles in the plasma.
Credit: Based on a vector diagram by Wikimedia user Д.Ильин which itself is based on a diagram from sun.org
License: CC-BY-4.0 Creative Commons 저작자표시 4.0 국제 (CC BY 4.0) icons