This page describes an image Seasons
Télécharger le fichier ( image 1.09 MB)
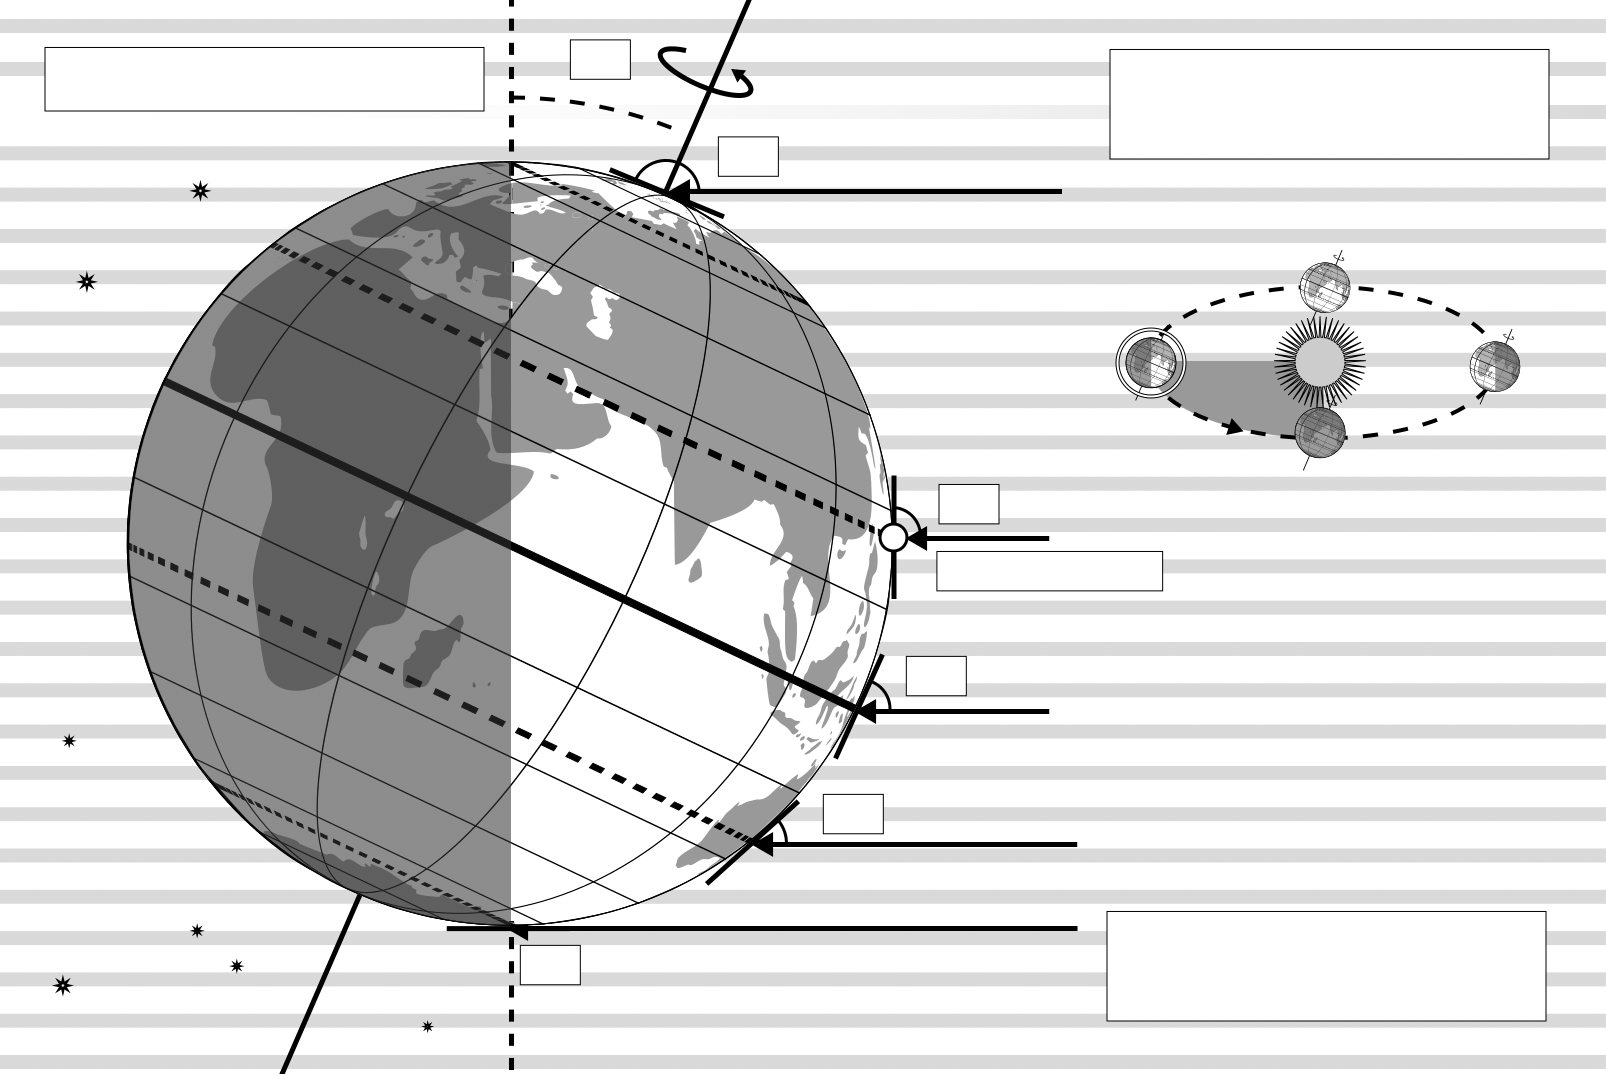
Also available in black and white
Télécharger le fichier ( image 400.17 kB)
Télécharger le fichier PDF (PDF file 477.01 kB)
Légende du diagramme :
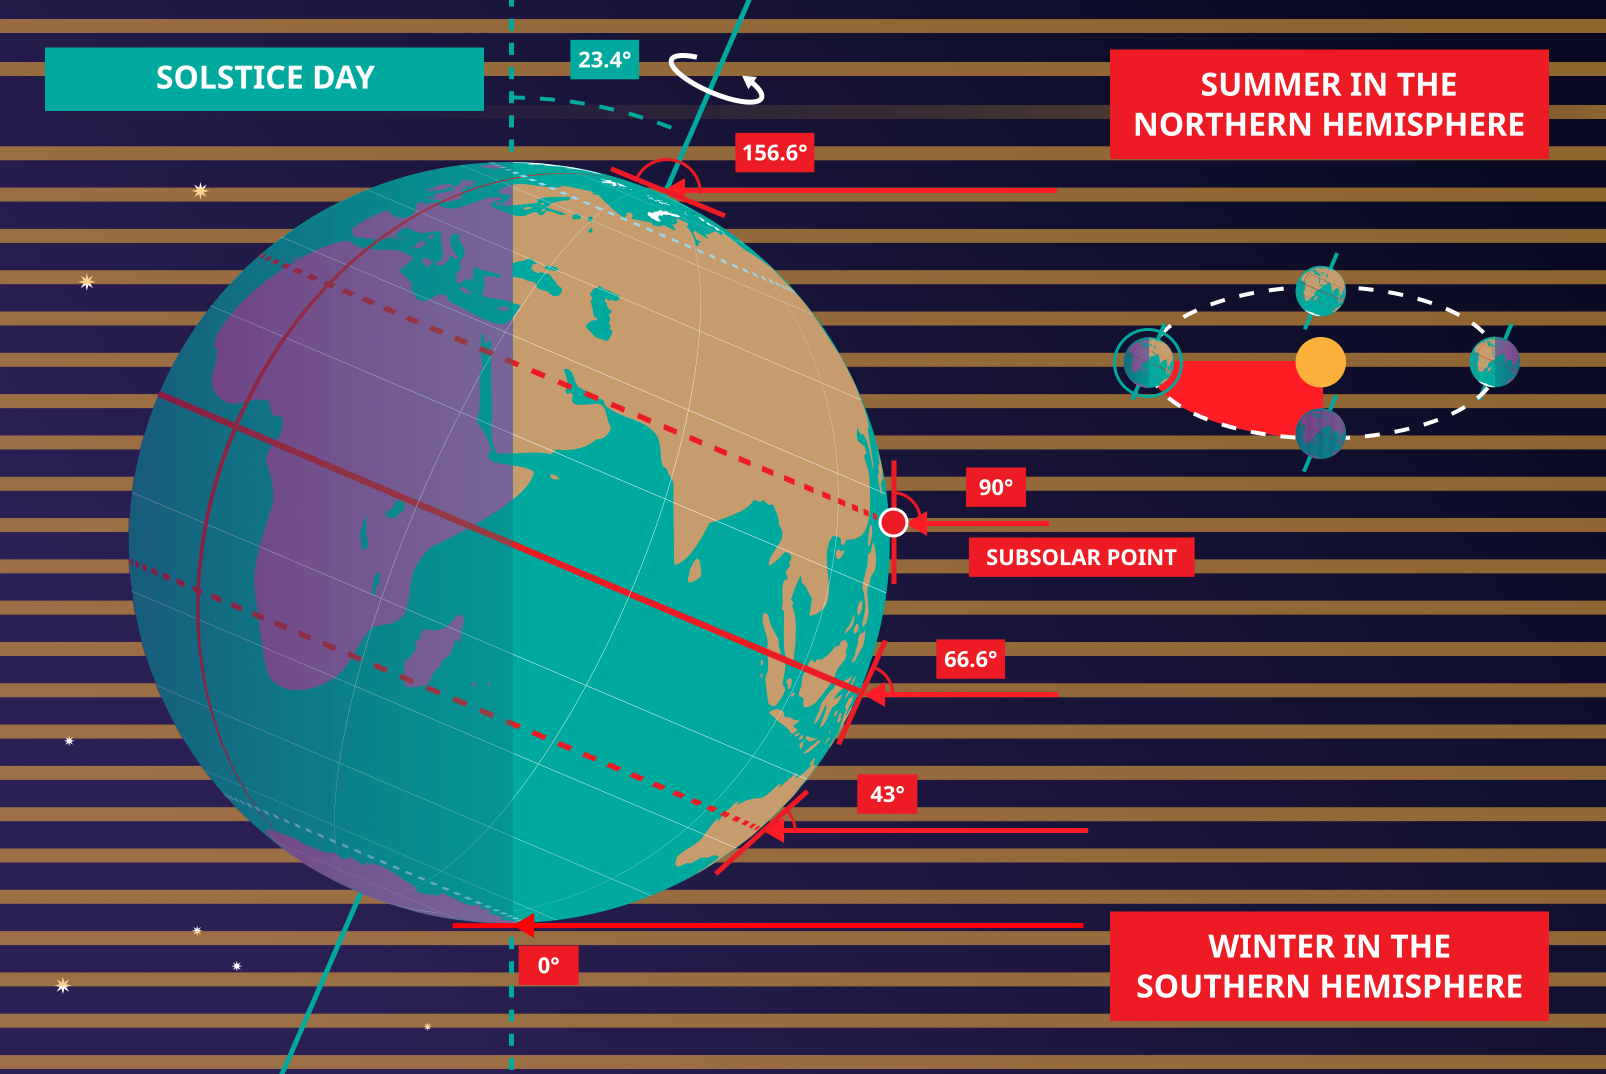
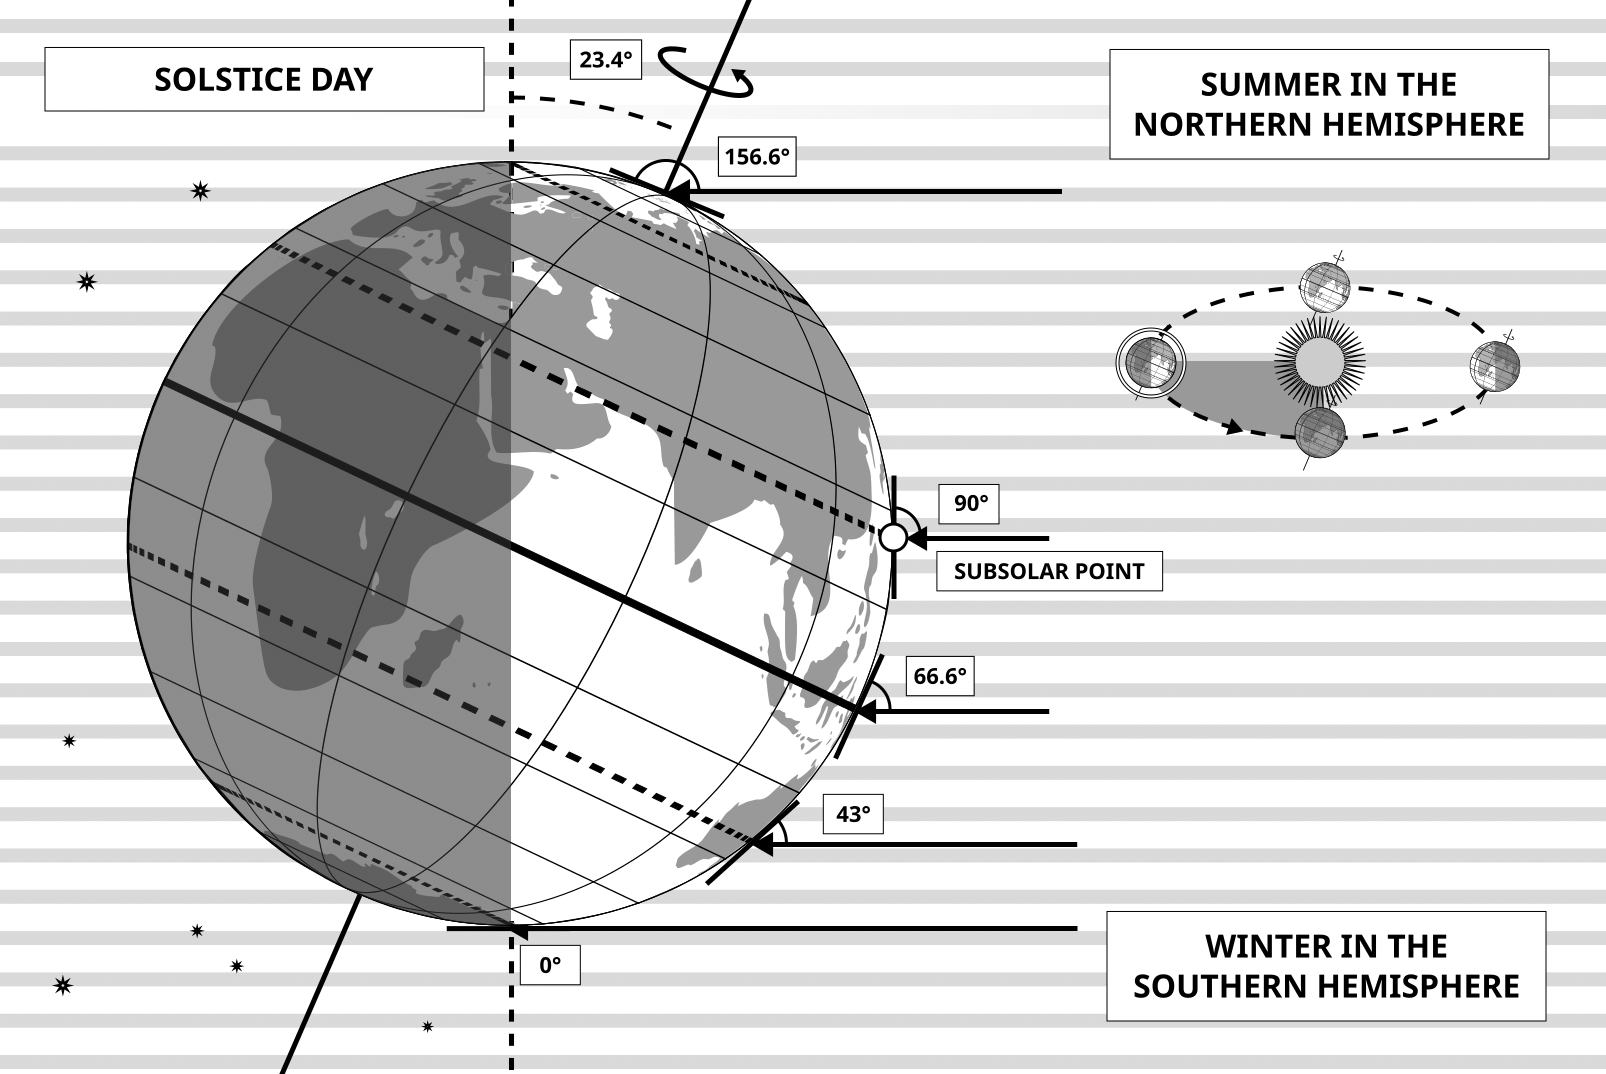
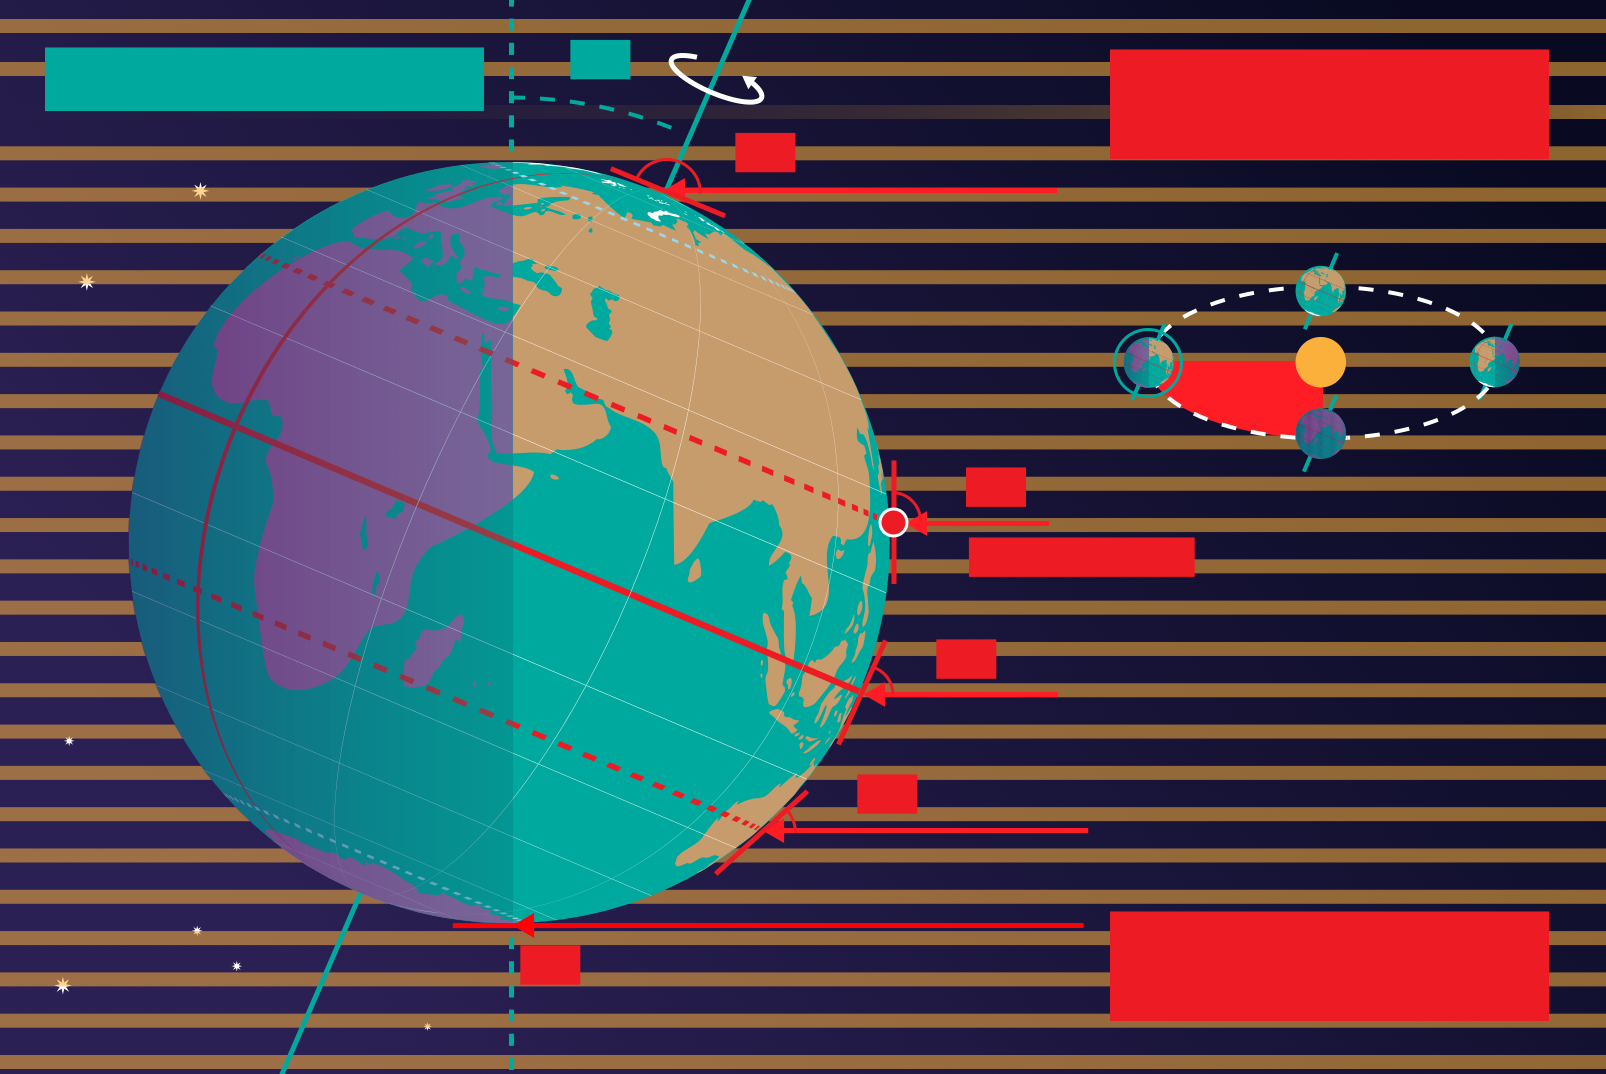
This diagram shows the Earth at the June solstice which is known as the summer solstice in the Northern Hemisphere and the winter solstice in the Southern Hemisphere. The Earth’s axis of rotation is tilted from the axis of the Earth’s orbit around the Sun by 23.4°. Here we see light from the sun represented as parallel lines, in the diagram the Sun would lie far off the right-hand edge. Five lines are marked with angles. These lines hit the Earth at special latitudes. From top to bottom these lines hit the Earth at the North Pole, the Tropic of Cancer, the Equator, the Tropic of Capricorn and the Antarctic Circle. The lines are shown hitting the Earth at the longitude where it is currently noon. For the last four lines, the angles marked show the angle above the horizon (the altitude) which the Sun appears in the sky at at local noon.
At the June solstice, the Sun will appear directly overhead at local noon on every point on the Tropic of Capricorn. By contrast the Sun reaches a maximum altitude of 0° at local noon on every point in the Antarctic Circle. This means the Sun never rises and every point south of the Antarctic Circle experiences a long Polar Night. By contrast the Sun never sets on this day north of the Arctic Circle and the regions here experience a Polar Day. The at the North Pole the Sun will remain at a constant altitude all day. This altitude will be the angle 180°-156.6° (23.4°).
The altitude the Sun appears at is important as it defines how spread out the Sun’s rays are on the Earth’s surface. Look at the thick, faint parallel lines in the background. Notice how at the Tropic of Cancer the area the lines intersect with the Earth’s surface perpendicularly and the line only covers a small part of the Earth’s surface. Now look at a line near the Tropic of Capricorn and see that this intersects with the Earth at a grazing angle and the line is spread out, covering a much wider area of the Earth’s surface. This means that a given amount of light from the Sun that hits the Tropic of Cancer is more concentrated and the same amount of light hitting the Tropic of Capricorn would be more spread out. This leads to more energy per unit area from the Sun hitting the Tropic of Cancer and less energy per unit area hitting the Tropic of Capricorn. This means it will be warmer at the Tropic of Cancer than at the Tropic of Capricorn. It is thus summer at the Tropic of Cancer and winter at the Tropic of Capricorn.
Six months later this situation will be reversed and it will be summer at the Tropic of Capricorn and winter at the Tropic of Cancer.
Crédit du diagramme : Maria Cristina Fortuna/IAU OAE.
État de la traduction du diagramme: Pas encore approuvé par un·e relecteur(rice)
Licence du diagramme : Creative Commons (CC) Attribution 4.0 International (CC BY 4.0) Creative Commons (CC) Attribution 4.0 International (CC BY 4.0) Icônes
Termes du glossaire en rapport :
Cercle antarctique
, Cercle arctique
, Hiver
, Pôle Nord
, Solstice
, Solstice d'hiver
, Solstice d'été
, Tropique du Cancer
, Tropique du Capricorne
, Équateur
Want to make your own translation or version of this diagram? Then
download the SVG
version of this diagram in English (544.89 kB). You can edit this using
software like Inkscape (free) or Adobe Illustrator
(proprietary). Just remember to credit the author of the original appropriately.
Also available in black and white ( image 544.89 kB).
You can also make your own version or translation of this diagram by adding adding text to a version of
this diagram with no text. Just download one of the following files:
Download Text-Free File ( image 1.05 MB)
Download Text-Free PDF File (PDF file 344.14 kB)
Also available in black and white:
Download Text-Free File ( image 364.23 kB)
Download Text-Free PDF File (PDF file 471.81 kB)
Les légendes des diagrammes sur le site de l'OAE ont été écrites, traduites et relues grâce à un effort collectif de l'OAE, les Centres et les Noeuds de l'OAE, les Coordinateurs Nationaux de l'Astronomie pour l'Education de l'OAE(NAECs) et d'autres volontaires. La liste complète des crédits pour ce projet est disponible ici . Toutes les légendes des fichiers média sont déposés sous licence Creative Commons CC BY-4.0 et doivent être créditées au nom de "IAU OAE". Les fichiers média eux-mêmes peuvent avoir des licences différentes (voir plus haut) et et doivent être crédités comme indiqué ci-dessus sous le terme "credit".
Si vous constatez une erreur dans ce diagramme ou sa légende, veuillez nous contacter .
Ceci pourrait vous intéresser également




- Ressources
- Moteur de recherche des ressources pédagogiques
- Parcourir les ressources pédagogiques par Sujet
- Parcourir les images
- AstroEdu - Activités en classe
- Grandes Idées - Littéracie en astronomie
- Glossaire
- Rapports de l'OAE
- L'astronomie pour l'Education à travers le monde
- Sélection de ressources externes