This page describes an image Solar absorption lines
Descargar archivo ( imagen 3.09 MB)
Pie de foto:
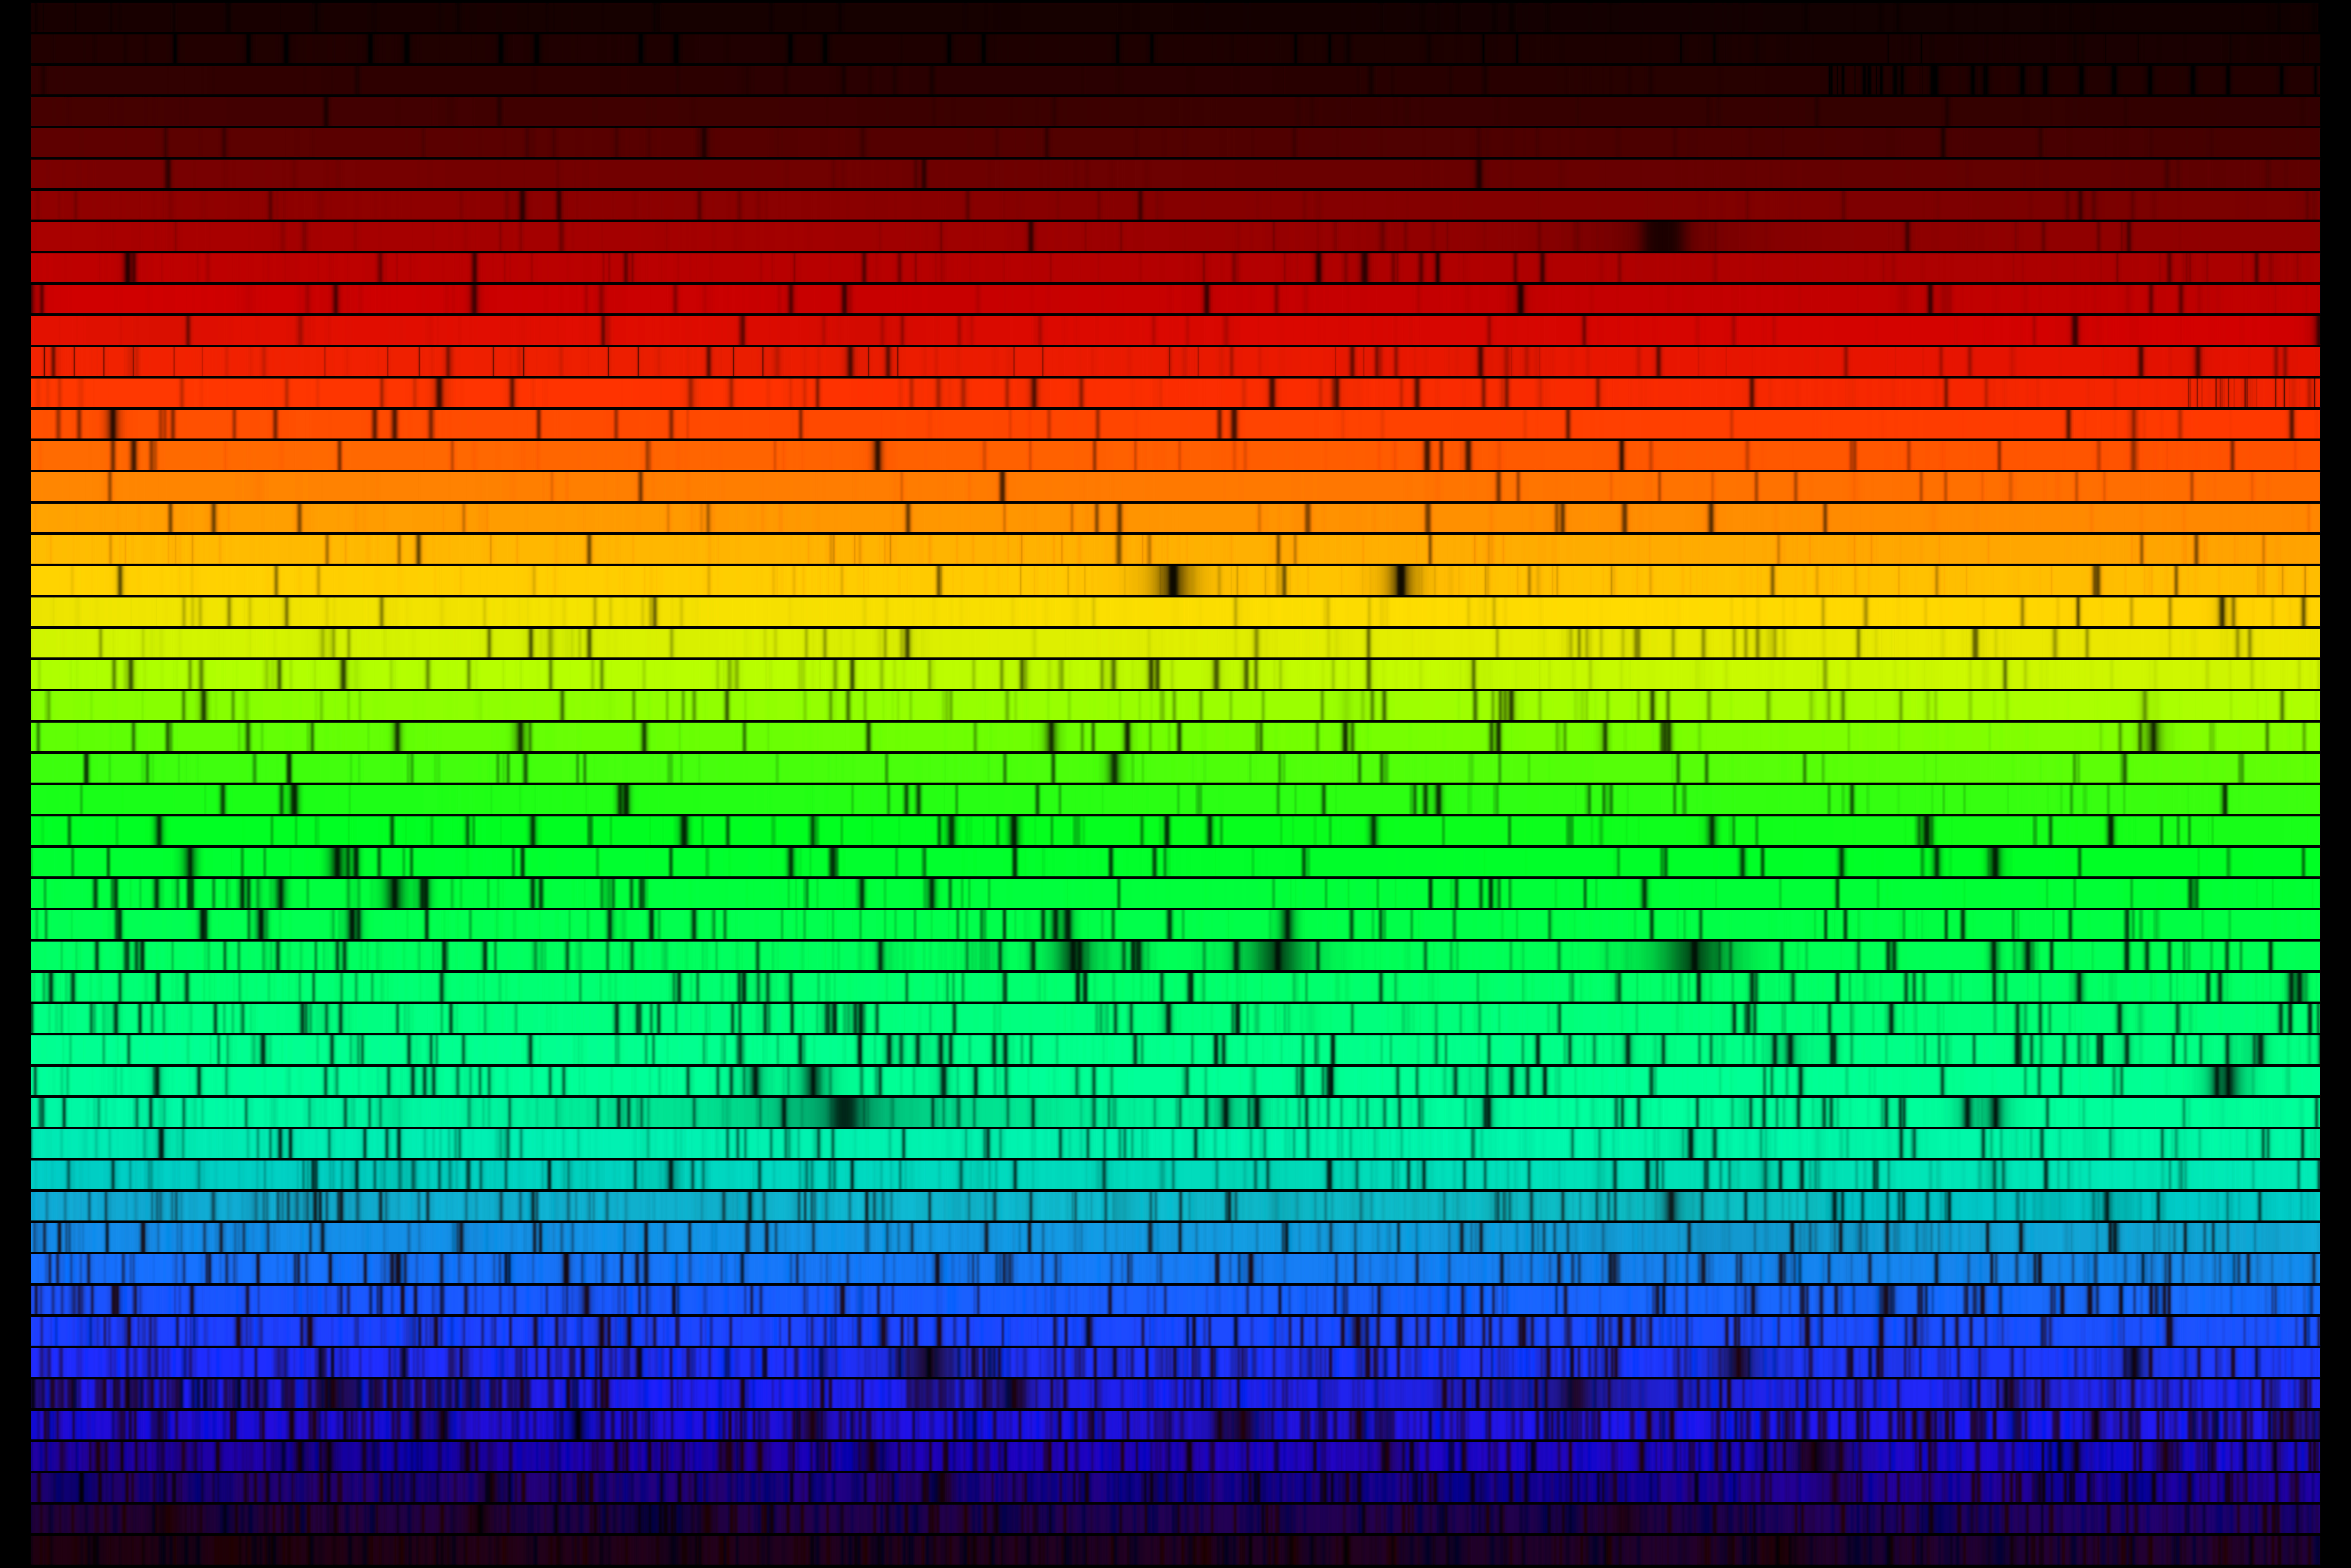
This is a high resolution spectrum of light from our Sun showing visible region of the electromagnetic spectrum. The absorption lines are visible clearly as narrow black regions. The visualization shown here was created to mimic a so-called echelle spectrum, with wavelength increasing from left to right along each strip, and from bottom to top. Each of the 50 horizontal strips covers 6 nanometers, for a complete spectrum across the visible range from 400 to 700 nanometers.
This spectrum was created from a digital atlas observed with the Fourier Transform Spectrometer at the McMath-Pierce Solar Facility at the National Solar Observatory on Kitt Peak, near Tucson, Arizona (‘Solar Flux Atlas from 296 to 1300 nm" by Robert L. Kurucz, Ingemar Furenlid, James Brault, and Larry Testerman: National Solar Observatory Atlas No. 1, June 1984).
Note: NSO/Kitt Peak FTS data used here were produced by NSF/NOAO.
Desplázate hasta los subtítulos en otros idiomas
Crédito de la imagen: N.A. Sharp/KPNO/NOIRLab/NSO/NSF/AURA Enlace del crédito
Términos relacionados del glosario:
Astrofísica
, Espectro visible
, Línea de absorción
, Línea espectral
Licencia de la imagen: Creative Commons Reconocimiento 4.0 Internacional (CC BY 4.0) Creative Commons Reconocimiento 4.0 Internacional (CC BY 4.0) íconos
Las descripciones de los archivos multimedia que aparecen en la página web de la OAE han sido redactadas, traducidas y revisadas gracias al esfuerzo conjunto de la OAE y los Centros y Nodos de la OAE, los Coordinadores Nacionales de Educación Astronómica (NAECs) y otros voluntarios. Puedes consultar la lista completa de los créditos de nuestro proyecto de traducción aquí. Todos los pies de foto de los archivos multimedia se publican bajo una Creative Commons CC BY-4.0 licencia y deben atribuirse a la "IAU OAE". Los propios archivos multimedia pueden tener diferentes licencias (véase más arriba) y deben citarse tal y como se indica en "credit".
Pies de foto en diferentes idiomas:
Pie de foto: Zu sehen ist ein hochauflösendes Spektrum unserer Sonne, das den sichtbaren Bereich des elektromagnetischen Spektrums zeigt. Die Absorptionslinien sind deutlich als schmale, schwarze Bereiche zu erkennen. Die hier gezeigte Darstellung wurde so gestaltet, dass sie einem sogenannten Echelle-Spektrum nachempfunden ist, bei dem die Wellenlänge entlang jedes Streifens von links nach rechts sowie von unten nach oben zunimmt. Jeder der 50 horizontalen Streifen deckt 6 Nanometer ab, sodass ein vollständiges Spektrum über den sichtbaren Bereich von 400 bis 700 Nanometer entsteht.
Dieses Spektrum wurde anhand eines digitalen Atlas erstellt, der mit dem Fourier-Transform-Spektrometer an der McMath-Pierce Solar Facility des National Solar Observatory auf dem Kitt Peak in der Nähe von Tucson, Arizona, beobachtet wurde („Solar Flux Atlas from 296 to 1300 nm“ von Robert L. Kurucz, Ingemar Furenlid, James Brault und Larry Testerman: National Solar Observatory Atlas Nr. 1, Juni 1984).
Anmerkung: Die hier verwendeten NSO/Kitt Peak-FTS-Daten wurden von der NSF/NOAO erstellt.
Crédito de la imagen: N.A. Sharp/KPNO/NOIRLab/NSO/NSF/AURA
Términos relacionados del glosario: Absorptionslinie , Astrophysik , Sichtbares Spektrum , Spektrallinie Estado de la traducción de los subtítulos: Aún no ha sido aprobado por un revisor o revisora
Traductores de las leyendas: Simon Kraus
Pie de foto: This is a high resolution spectrum of light from our Sun showing visible region of the electromagnetic spectrum. The absorption lines are visible clearly as narrow black regions. The visualization shown here was created to mimic a so-called echelle spectrum, with wavelength increasing from left to right along each strip, and from bottom to top. Each of the 50 horizontal strips covers 6 nanometers, for a complete spectrum across the visible range from 400 to 700 nanometers.
This spectrum was created from a digital atlas observed with the Fourier Transform Spectrometer at the McMath-Pierce Solar Facility at the National Solar Observatory on Kitt Peak, near Tucson, Arizona (‘Solar Flux Atlas from 296 to 1300 nm" by Robert L. Kurucz, Ingemar Furenlid, James Brault, and Larry Testerman: National Solar Observatory Atlas No. 1, June 1984).
Note: NSO/Kitt Peak FTS data used here were produced by NSF/NOAO.
Crédito de la imagen: N.A. Sharp/KPNO/NOIRLab/NSO/NSF/AURA
Términos relacionados del glosario: Absorption Line , Astrophysics , Spectral Line , Visible Spectrum
Pie de foto: Questo è uno spettro ad alta risoluzione della luce proveniente dal nostro Sole che mostra la regione visibile dello spettro elettromagnetico. Le righe di assorbimento sono chiaramente visibili come sottili bande nere. La visualizzazione qui riportata è stata creata per riprodurre un cosiddetto spettro echelle, con la lunghezza d’onda che aumenta da sinistra a destra lungo ciascuna striscia e dal basso verso l’alto. Ciascuna delle 50 strisce orizzontali copre 6 nanometri, per uno spettro completo che abbraccia l’intervallo visibile da 400 a 700 nanometri.
Questo spettro è stato ricavato da un atlante digitale ottenuto con lo spettrometro a trasformata di Fourier presso la McMath-Pierce Solar Facility del National Solar Observatory a Kitt Peak, vicino a Tucson, in Arizona («Solar Flux Atlas from 296 to 1300 nm» di Robert L. Kurucz, Ingemar Furenlid, James Brault e Larry Testerman: National Solar Observatory Atlas n. 1, giugno 1984).
Nota: i dati FTS dell’NSO/Kitt Peak qui utilizzati sono stati prodotti dalla NSF/NOAO.
Crédito de la imagen: N.A. Sharp/KPNO/NOIRLab/NSO/NSF/AURA
Términos relacionados del glosario: Astrofisica , Linea spettrale , Riga di assorbimento , Spettro visibile Estado de la traducción de los subtítulos: Aún no ha sido aprobado por un revisor o revisora
Traductores de las leyendas: Giuliana Giobbi