Loading...
Documents & Resources - Search Results
Search results
Stellar spectral types - bands
image
Created for the OAE
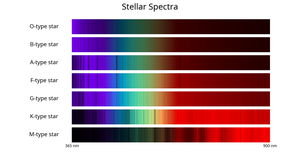
Caption: The spectra of seven stars ordered by spectral type ranging from the hottest (O-type) at the top to the coolest (M-type at the bottom). The x-axis shows the wavelength of light while the brightness or darkness at each wavelength corresponds to the flux of light received from the star at that wavelength with darker patches having less flux and brighter patches more. Each spectrum is normalized (the flux at each wavelength is divided by the maximum flux for that spectrum) so that the maximum flux should appear with the same brightness for all the spectra. The colour plotted between 400 nm and 700 nm roughly corresponds to the color the human eye would see light of that wavelength. Below 400 nm and above 700 nm, where the human eye can see little to no light, the lines are coloured blue and red respectively. The hotter stars have more of their flux at the bluer end of the spectrum and the cooler stars have more of their flux at the redder end. However the total amount of flux a star emits depends on its size and temperature. Due to this, a hot star will emit more red light than a cool star of the same size even if the cool star emits almost all its light in red light but this is not visible in this plot due to the normalization mentioned above. The dark, narrow patches in the spectra are absorption lines caused by atoms and ions in the stars’ atmospheres. The strength of a spectral line depends on the temperature of a star’s atmosphere. Take the hydrogen line at 656.5 nm as an example. All of the stars in this plot are primarily made of hydrogen, but the 656.5 nm hydrogen line is weak for the hottest and coolest stars but strongest for spectral types A and F. This is because hydrogen absorbs more light at 656.5 nm at the temperatures of A and F stars’ atmospheres than in hotter or cooler stars. The coolest star here, the M-type star, has wide absorption bands in its spectra. This is because this star is cool enough to have compounds such as titanium oxide in its atmosphere. These compounds, often called molecules in astronomy, produce wider spectral absorption features than atoms or ions. Credit: IAU OAE/SDSS/Niall Deacon
Glossary Terms: Spectral Type , Spectrum , Wavelength
Categories: Stars License: Creative Commons Attribution 4.0 International (CC BY 4.0) Creative Commons Attribution 4.0 International (CC BY 4.0) icons
File ( image 53.91 kB)
PDF File (PDF file 26.29 kB)
Stellar spectral types
image
Created for the OAE
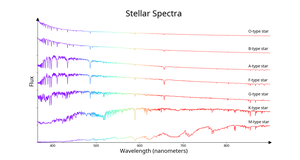
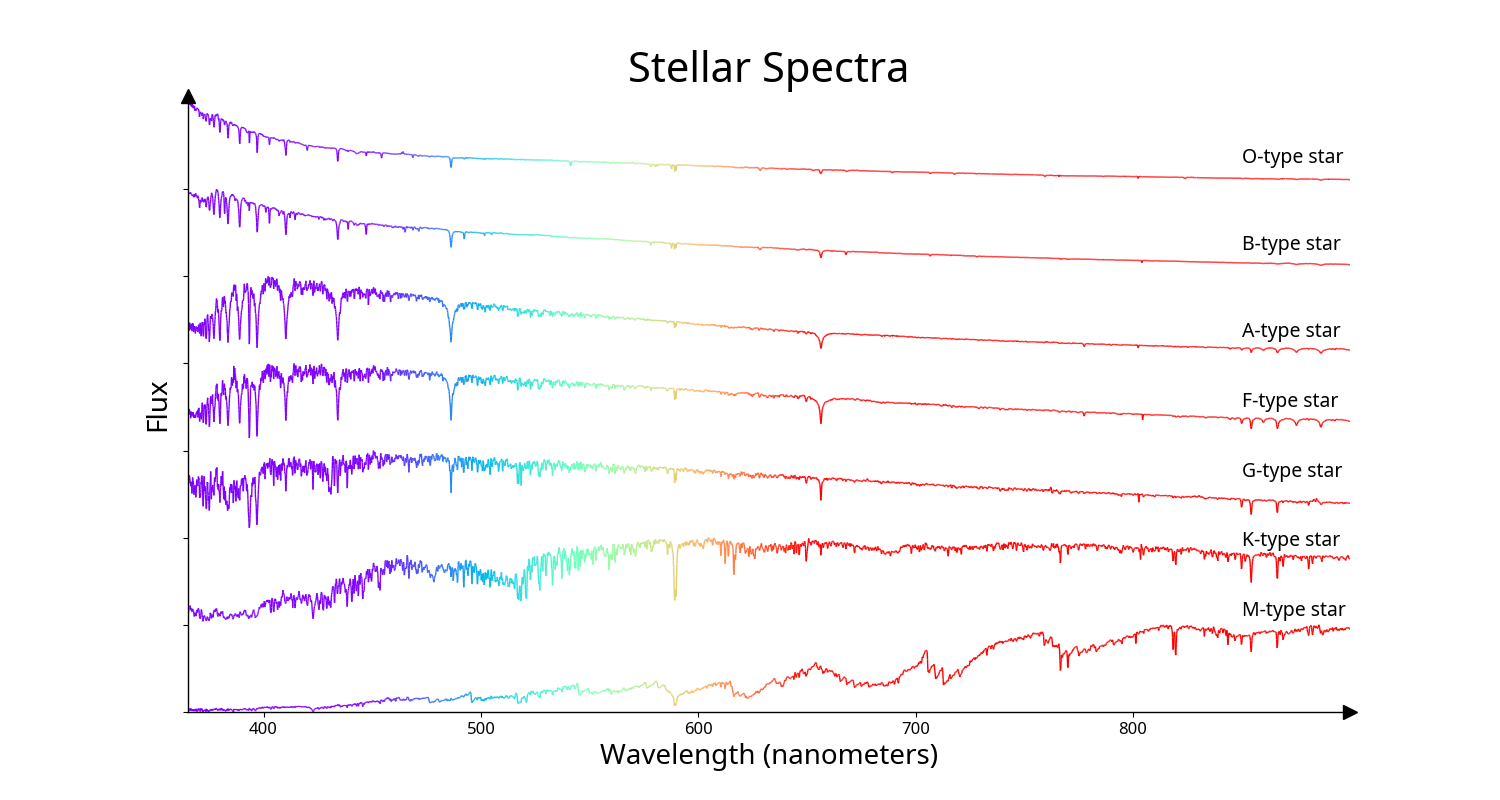
Caption: The spectra of seven stars ordered by spectral type ranging from the hottest (O-type) at the top to the coolest (M-type at the bottom). The x-axis shows the wavelength of light and the y-axis is a measure of the flux of light received at that wavelength. Each spectrum is normalized (the flux at each wavelength is divided by the maximum flux in that spectrum) and the spectra are then offset from each other along the y-axis to make the plot easier to view. The colour of the lines between 400 nm and 700 nm roughly corresponds to the colour the human eye would see light of that wavelength. Below 400 nm and above 700 nm, where the human eye can see little to no light, the lines are coloured blue and red respectively. The hotter stars have more of their flux at the bluer end of the spectrum and the cooler stars have more of their flux at the redder end. However the total amount of flux a star emits depends on its size and temperature. Due to this, a hot star will emit more red light than a cool star of the same size even if the cool star emits almost all its light in red light but this is not visible in this plot due to the normalization mentioned above. The sharp, narrow drops in the spectra are absorption lines caused by atoms and ions in the stars’ atmospheres. The strength of a spectral line depends on the temperature of a star’s atmosphere. Take the hydrogen line at 656.5 nm as an example. All of the stars in this plot are primarily made of hydrogen, but the 656.5 nm hydrogen line is weak for the hottest and coolest stars but strongest for spectral types A and F. This is because hydrogen absorbs more light at 656.5 nm at the temperatures of A and F stars’ atmospheres than in hotter or cooler stars. The coolest star here, the M-type star, has wide absorption bands in its spectra. This is because this star is cool enough to have compounds such as titanium oxide in its atmosphere. These compounds, often called molecules in astronomy, produce wider spectral absorption features than atoms or ions. Credit: IAU OAE/SDSS/Niall Deacon
Glossary Terms: Spectral Type , Spectrum , Wavelength
Categories: Stars License: Creative Commons Attribution 4.0 International (CC BY 4.0) Creative Commons Attribution 4.0 International (CC BY 4.0) icons
File ( image 185.71 kB)
PDF File (PDF file 393.16 kB)
Spectrum of an M-type star
image
Created for the OAE
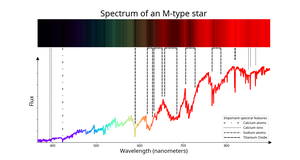
Caption: The spectrum of the M-type star 2MASS J15581272+8457104. The colour of the line between 400 nm and 700 nm roughly corresponds to the colour the human eye would see light of that wavelength. Below 400 nm and above 700 nm, where the human eye can see little to no light, the lines are coloured blue and red respectively. The black lines show spectral absorption lines caused by atoms, ions and molecules of different elements in the star’s atmosphere. These atoms, ions and molecules absorb at specific wavelengths, causing sharp, dark lines in the spectra. How strong these lines are depends on the temperature of the star’s atmosphere. Two stars made from the same mix of elements could have spectra with vastly different sets of lines in their spectra if they have different temperatures in their atmospheres. The atmospheres of M-type stars are cool enough for some chemical compounds to form. These are often referred to as molecules in astronomy, even if they are not strictly molecules in chemistry. These molecules produce so many lines in an M-type star’s spectrum that the lines appear to merge together in huge bands that remove large chunks from the spectrum. In M-type stars, titanium oxide has a large number of these bands in visible light, dominating huge regions of the spectrum. Credit: IAU OAE/SDSS/Niall Deacon
Glossary Terms: Spectrum , Wavelength , M-type Star
Categories: Stars License: Creative Commons Attribution 4.0 International (CC BY 4.0) Creative Commons Attribution 4.0 International (CC BY 4.0) icons
File ( image 100.86 kB)
PDF File (PDF file 74.55 kB)
Spectrum of a K-type star
image
Created for the OAE
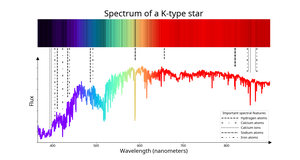
Caption: The spectrum of the K-type star 2MASS J19554455+4754531. The colour of the line between 400 nm and 700 nm roughly corresponds to the colour the human eye would see light of that wavelength. Below 400 nm and above 700 nm, where the human eye can see little to no light, the lines are coloured blue and red respectively. The black lines show spectral absorption lines caused by atoms and ions of different elements in the star’s atmosphere. These atoms and ions absorb at specific wavelengths, causing sharp, dark lines in the spectra. How strong these lines are depends on the temperature of the star’s atmosphere. Two stars made from the same mix of elements could have spectra with vastly different sets of lines in their spectra if they have different temperatures in their atmospheres. The spectra of K-type stars are dominated by metal atoms such as iron, sodium and calcium atoms. There are so many lines from metal atoms, far too many to mark individually, that the spectrum has a choppy, ragged appearance. The lines of hydrogen atoms and calcium ions are much weaker than in the hotter G-type stars. Credit: IAU OAE/SDSS/Niall Deacon
Glossary Terms: K-type Star , Spectrum , Wavelength
Categories: Stars License: Creative Commons Attribution 4.0 International (CC BY 4.0) Creative Commons Attribution 4.0 International (CC BY 4.0) icons
File ( image 111.47 kB)
PDF File (PDF file 75.79 kB)

Spectrum of a G-type star
image
Created for the OAE
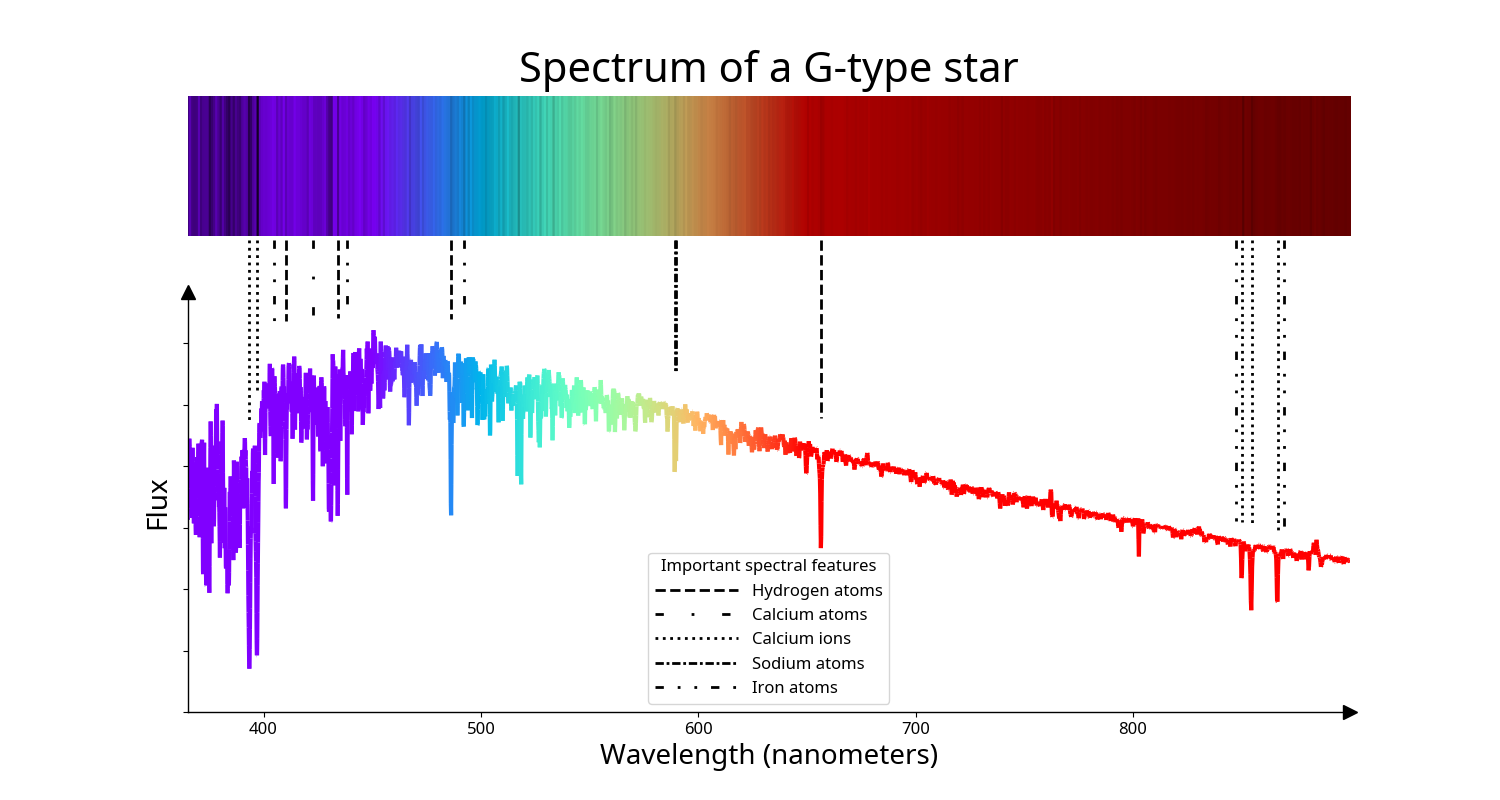
Caption: The spectrum of the G-type star UCAC4 700-069569. The colour of the line between 400 nm and 700 nm roughly corresponds to the colour the human eye would see light of that wavelength. Below 400 nm and above 700 nm, where the human eye can see little to no light, the lines are coloured blue and red respectively. The black lines show spectral absorption lines caused by atoms and ions of different elements in the star’s atmosphere. These atoms and ions absorb at specific wavelengths, causing sharp, dark lines in the spectra. How strong these lines are depends on the temperature of the star’s atmosphere. Two stars made from the same mix of elements could have spectra with vastly different sets of lines in their spectra if they have different temperatures in their atmospheres. In G-type stars lines from hydrogen atoms are weaker than in F-type stars and lines from ionised calcium stronger. Lines from metal atoms such as atoms of iron, sodium and calcium also begin to become prominent. Credit: IAU OAE/SDSS/Niall Deacon
Glossary Terms: Spectrum , Wavelength , G-type Star
Categories: Stars License: Creative Commons Attribution 4.0 International (CC BY 4.0) Creative Commons Attribution 4.0 International (CC BY 4.0) icons
File ( image 98.84 kB)
PDF File (PDF file 75.42 kB)
