Loading...
Documents & Resources - Search Results
Search results
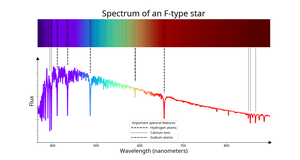
Spectrum of an F-type star
image
Created for the OAE
Caption: The spectrum of the F-type star 2MASS J22243289+4937443. The colour of the line between 400 nm and 700 nm roughly corresponds to the colour the human eye would see light of that wavelength. Below 400 nm and above 700 nm, where the human eye can see little to no light, the lines are coloured blue and red respectively. The black lines show spectral absorption lines caused by atoms and ions of different elements in the star’s atmosphere. These atoms and ions absorb at specific wavelengths, causing sharp, dark lines in the spectra. How strong these lines are depends on the temperature of the star’s atmosphere. Two stars made from the same mix of elements could have spectra with vastly different sets of lines in their spectra if they have different temperatures in their atmospheres. The lines from hydrogen atoms that are strongest in A-type stars are still relatively strong in F-type stars but lines from metals, particularly ionised calcium begin to become strong at this spectral type. Credit: IAU OAE/SDSS/Niall Deacon
Glossary Terms: F-type Star , Spectrum , Wavelength
Categories: Stars License: Creative Commons Attribution 4.0 International (CC BY 4.0) Creative Commons Attribution 4.0 International (CC BY 4.0) icons
File ( image 96.47 kB)
PDF File (PDF file 74.72 kB)
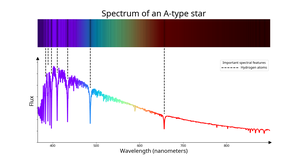
Spectrum of an A-type star
image
Created for the OAE
Caption: The spectrum of the A-type star BD-11 1212. The colour of the line between 400 nm and 700 nm roughly corresponds to the colour the human eye would see light of that wavelength. Below 400 nm and above 700 nm, where the human eye can see little to no light, the lines are coloured blue and red respectively. The black lines show spectral absorption lines caused by atoms and ions of different elements in the star’s atmosphere. These atoms and ions absorb at specific wavelengths, causing sharp, dark lines in the spectra. How strong these lines are depends on the temperature of the star’s atmosphere. Two stars made from the same mix of elements could have spectra with vastly different sets of lines in their spectra if they have different temperatures in their atmospheres. Lines from hydrogen atoms dominate the spectra of A-type stars and are strongest at this spectral type. Credit: IAU OAE/SDSS/Niall Deacon
Glossary Terms: A-type Star , Spectrum , Wavelength
Categories: Stars License: Creative Commons Attribution 4.0 International (CC BY 4.0) Creative Commons Attribution 4.0 International (CC BY 4.0) icons
File ( image 84.67 kB)
PDF File (PDF file 74.28 kB)

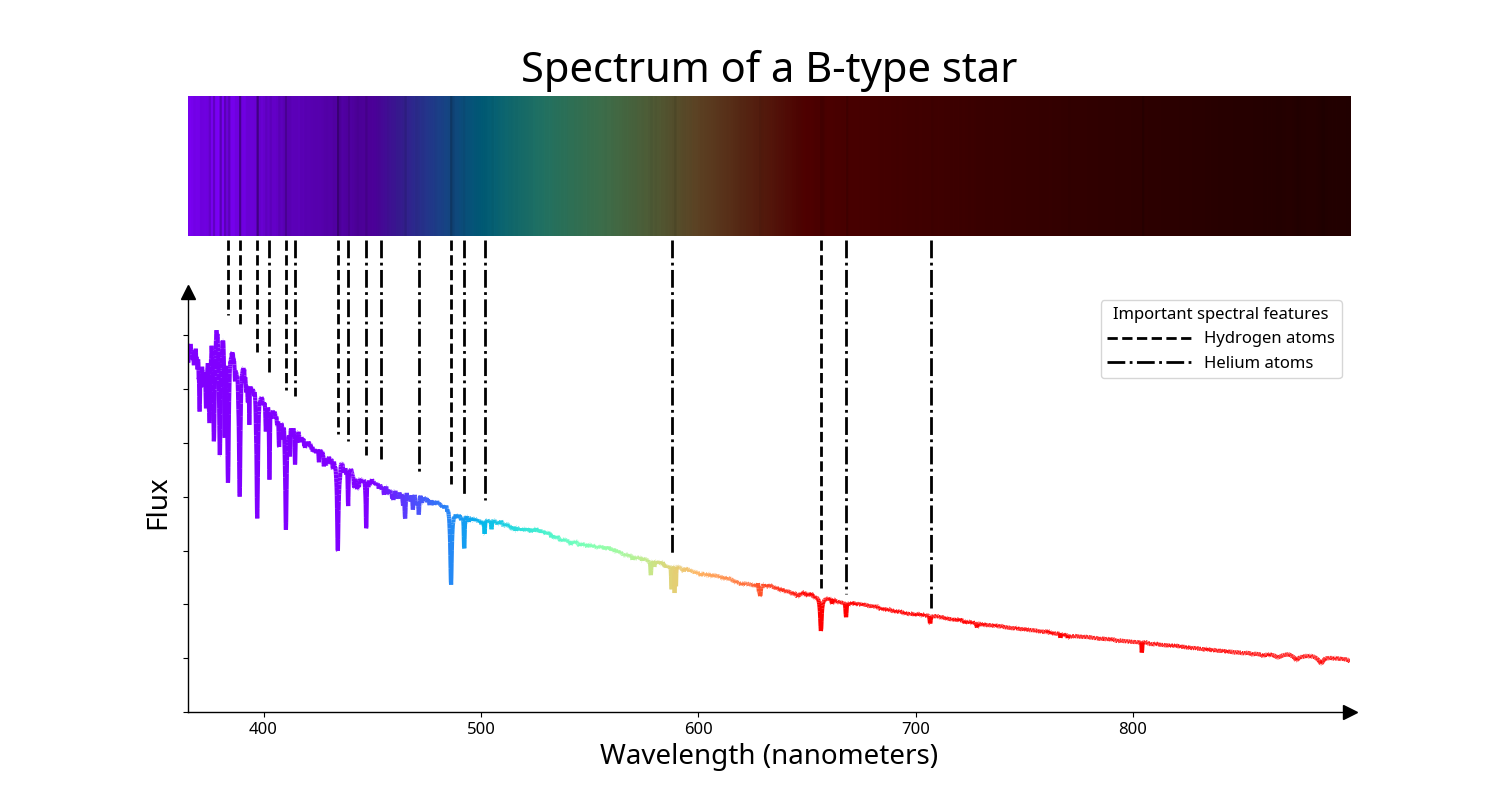
Spectrum of a B-type star
image
Created for the OAE
Caption: The spectrum of the B-type star HD 258982. The colour of the line between 400 nm and 700 nm roughly corresponds to the colour the human eye would see light of that wavelength. Below 400 nm and above 700 nm, where the human eye can see little to no light, the lines are coloured blue and red respectively. The black lines show spectral absorption lines caused by atoms and ions of different elements in the star’s atmosphere. These atoms and ions absorb at specific wavelengths, causing sharp, dark lines in the spectra. How strong these lines are depends on the temperature of the star’s atmosphere. Two stars made from the same mix of elements could have spectra with vastly different sets of lines in their spectra if they have different temperatures in their atmospheres. For B-type stars the most important lines are caused by helium atoms. These lines are strongest in B-type stars and weaker in hotter and cooler types. Lines from hydrogen atoms are also present but are not as strong as in cooler A-type stars. Credit: IAU OAE/SDSS/Niall Deacon
Glossary Terms: B-type Star , Spectrum , Wavelength
Categories: Stars License: Creative Commons Attribution 4.0 International (CC BY 4.0) Creative Commons Attribution 4.0 International (CC BY 4.0) icons
File ( image 76.71 kB)
PDF File (PDF file 73.33 kB)

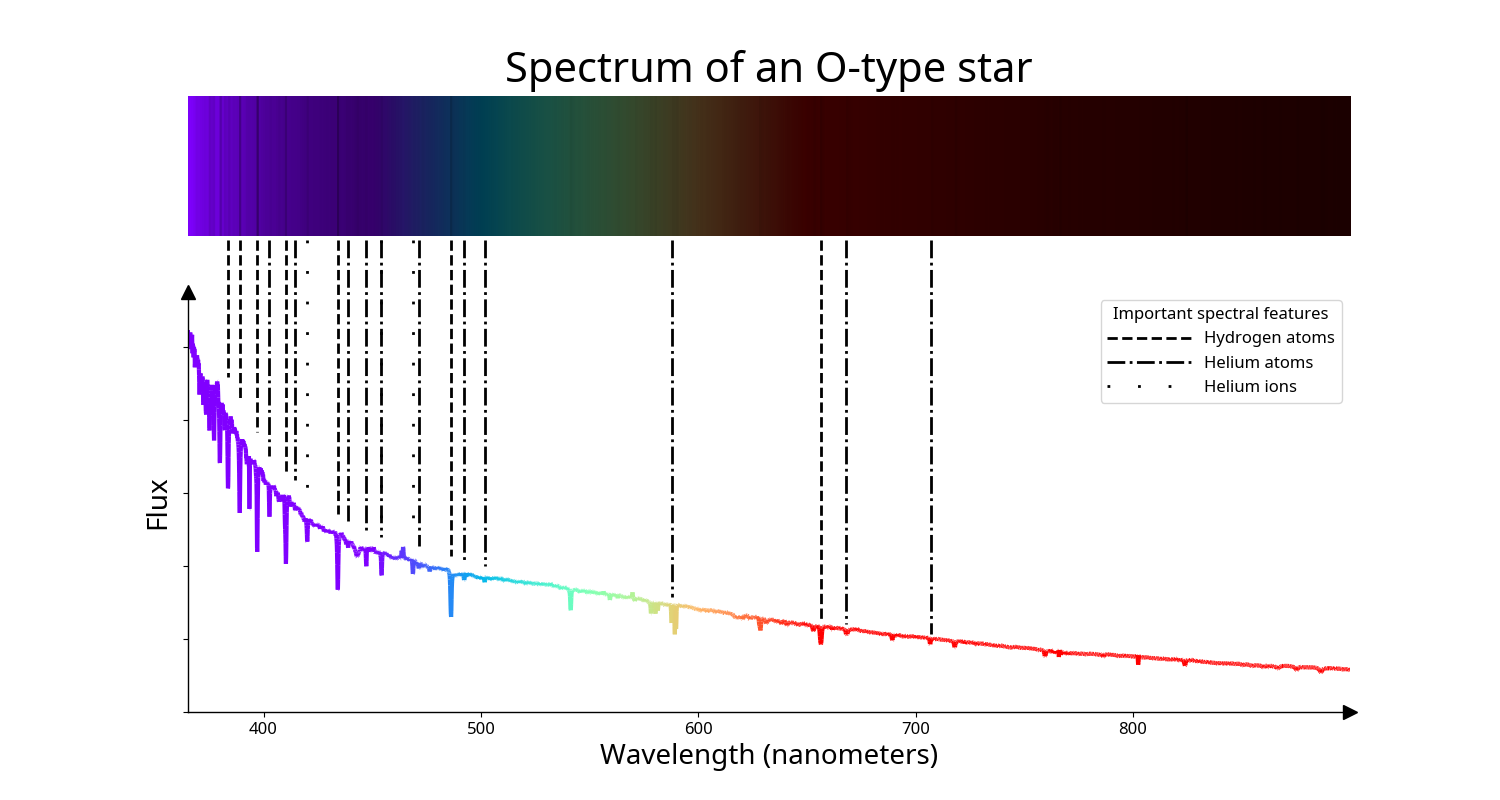
Spectrum of an O-type star
image
Created for the OAE
Caption: The spectrum of the O-type star HD 235673 with wavelength in nanometers on the x-axis and flux on the y-axis. The top part of the plot shows the same spectrum but with bright patches for wavelengths with high flux and dark patches for wavelengths with low flux. The colour of the line between 400 nm and 700 nm roughly corresponds to the colour the human eye would see light of that wavelength. Below 400 nm and above 700 nm, where the human eye can see little to no light, the lines are coloured blue and red respectively. The black lines show spectral absorption lines caused by atoms and ions of different elements in the star’s atmosphere. These atoms and ions absorb at specific wavelengths, causing sharp, dark lines in the spectra. How strong these lines are depends on the temperature of the star’s atmosphere. Two stars made from the same mix of elements could have spectra with vastly different sets of lines in their spectra if they have different temperatures in their atmospheres. For O-type stars the most important features are a small number of lines caused by ionized helium. These lines are stronger in O-type stars than in cooler stars. Lines from helium atoms and hydrogen atoms also appear in the spectrum. The spectrum has more flux at the blue end of the spectrum than at the red end of the spectrum. Credit: IAU OAE/SDSS/Niall Deacon
Glossary Terms: Spectrum , Wavelength , O-type Star
Categories: Stars License: Creative Commons Attribution 4.0 International (CC BY 4.0) Creative Commons Attribution 4.0 International (CC BY 4.0) icons
File ( image 77.14 kB)
PDF File (PDF file 72.71 kB)
